If your MQL count is up but SQLs, win rate, and pipeline are flat, your scoring model is probably the problem.
I’d boil this article down to one point: lead scoring should sort for fit, buying intent, timing, and follow-up - not just activity. When it doesn’t, teams get more MQLs, lower sales acceptance, weaker pipeline, and less stable forecasts.
Here’s the short version:
- Weak ICP fit rules let the wrong accounts score too high
- Bad intent weighting gives low-buying-signal actions too much credit
- Static models drift as buyer behavior changes
- No decay or negative scoring keeps old leads ranked too high
- Messy, siloed rules make scores hard for sales to trust
- Slow handoff and follow-up waste good leads after scoring
- No revenue check means scores never prove they link to bookings
A few numbers make the issue plain:
- Average MQL-to-SQL conversion is about 13%
- Better-aligned teams can hit 35% to 40%
- Some teams see forecast variance of ±25% to ±30% when scoring is noisy
- Leads contacted within 5 minutes can be far more likely to convert than leads contacted later
My takeaway: more leads do not fix pipeline. Better scoring and tighter handoff do. If I were auditing this fast, I’d check fit rules, intent weights, score aging, sales SLA, and whether high-score leads beat low-score leads on revenue.
The $4M CRM Mistake: What Your Sales Pipeline Isn’t Telling You
sbb-itb-a84ebc4
Quick comparison
| Mistake | What it causes | What to fix first |
|---|---|---|
| Weak ICP fit | Low-fit MQLs, lower SQL rate | Add a fit gate before behavior matters |
| Bad intent weighting | High activity, low buying readiness | Reweight actions by conversion data |
| Static model | Score drift, weaker conversion | Review and recalibrate on a set cadence |
| No decay or negative scoring | Old leads stay inflated | Add recency bands, decay, and point removal |
| Siloed rules | Low sales trust, more rejections | Simplify rules with sales and marketing together |
| Weak handoff | Missed contact windows, lost demand | Set routing rules and response SLAs |
| No revenue validation | Scores look fine but miss bookings | Compare score bands to opps, win rate, and revenue |
If you want the plain answer, it’s this: a lead score is only useful when it helps sales work the right accounts at the right time - and when high scores turn into pipeline and closed-won revenue more often than low scores.
How Lead Scoring Mistakes Show Up in the Funnel
Lead scoring affects routing, MQL creation, follow-up speed, and the numbers used in the forecast. Using the right marketing funnel software helps automate these processes and ensures data flows correctly between systems. When it goes off track, pipeline quality slips. You usually see the damage first in conversion rates, deal size, win rate, and forecast variance.
The clearest warning sign is more MQLs without more SQLs or pipeline. If MQL volume climbs but SQLs and pipeline stay flat, the scoring model is likely letting the wrong leads through. That same problem tends to show up in average deal size and win rate too. Low-fit leads drag down ACV and make it harder for sales to close at the same rate. It starts with prioritization.
Forecast variance is another clear signal. Forecasts work on the idea that qualified pipeline will convert within a somewhat steady range. When scoring marks weak leads as qualified, that logic falls apart. Teams dealing with noisy scoring often end up with forecast variance of ±25% to ±30%, instead of a tighter ±10% to ±15%.
The table below shows which funnel metrics react fastest to scoring quality and what each shift usually means:
| Funnel Metric | Scoring-Related Warning Sign |
|---|---|
| MQL volume | Sudden spike without matching SQL or pipeline growth |
| MQL-to-SQL conversion | Persistent drop below the historical baseline after scoring changes |
| Opportunity rate | Fewer opportunities per SQL; sales skipping or rejecting MQLs |
| Win rate | Flat or falling despite more pipeline volume |
| Average deal size | Declining ACV as more small, low-fit deals enter pipeline |
| Forecast variance | Gaps between forecast and actuals widening quarter over quarter |
Each of the seven mistakes in this guide hits one or more of these metrics directly. Track them by scoring model version, not just at the top level. That’s how teams catch issues early. The first crack usually starts in fit rules, and once that happens, every metric downstream gets distorted.
1. Weak ICP and Fit Rules
Weak ICP rules are the most common reason lead scoring breaks down. When fit criteria are too loose, engagement can push low-quality accounts over the MQL line. That treats activity like a proxy for fit, which is where things go off track. Fit should act as a gate before engagement gets to matter.
Impact on MQL-to-SQL Conversion
Weak ICP rules push conversion below baseline. Tight fit rules can lift in-ICP conversion to 30% to 50%, while weak rules often pull MQL-to-SQL below 10% to 15%. That kind of gap usually points to a qualification issue, not a sales execution problem.
Effect on Pipeline Quality
Loose fit rules also clog the pipeline with low-probability deals. Win rates drop. Deal mix gets skewed. And sales tends to say the same thing over and over: the leads are too small, too early, or not the right buyer. Once that starts, forecast quality usually slips too.
Risk to Forecast Confidence
When too much of the pipeline comes from non-ICP accounts, stage probabilities stop matching what actually happens. Pipeline coverage can look fine on paper while bookings miss. That's how forecast variance grows - and trust in the numbers starts to fade.
RevOps Fix Priority
Start with closed-won data. Look for the firmographic and technographic traits those accounts share, then build a separate 0-100 fit score. From there, require a minimum fit score before behavior can trigger MQL status. If sales is rejecting more than 30% of MQLs for bad fit, tighten the ICP or lift the fit threshold.
Once fit is locked, the next leak is buying intent.
2. Missing or Misweighted Intent and Behavioral Signals
Fit tells you who belongs in the market. Intent tells you who is ready to buy now. You need both. If your model has fit but weak intent signals, it misses buyers who are already moving.
This is where a lot of teams go wrong: they treat all engagement the same. A blog read, an email open, and a pricing-page visit do not mean the same thing. When that happens, low-intent activity gets too much credit, while buying signals like pricing-page visits, demo starts, competitor research, and comparison-page views don't get enough weight. The most common problem is simple: the behavioral weights are off.
Impact on MQL-to-SQL Conversion
Bad weighting fills the funnel with weak MQLs and buries the strong ones. Sales sees more names, but fewer that look ready for a real conversation. Trust drops, and fewer handoffs get accepted.
The conversion gap can be huge. In one analysis, intent-prioritized accounts converted to closed opportunities at 21.3% versus 8.4% for non-prioritized accounts - about a 2.5x difference. If the weights are wrong, that gap does not fix itself.
Effect on Pipeline Quality
Generic engagement can push MQL volume up while opportunity flow goes the other way. The result is a noisier pipeline, more stalled deals, and lower win rates.
That kind of distortion doesn't stay contained. It moves downstream and shows up in forecast quality next.
Risk to Forecast Confidence
When low-intent leads dominate the score, stage conversion gets noisy. Commit calls become harder to back up. At the same time, missed high-intent accounts create swings in the forecast from both sides - deals that looked likely don't move, and deals that should have been surfaced never made it into the right motion.
RevOps Fix Priority
Start with historical conversion data and rebuild the weights from there. Then sort actions into high-, medium-, and low-intent bands so the model reflects what buyers actually do before they convert.
| Signal Type | Examples | Suggested Point Range |
|---|---|---|
| High intent | Demo request, pricing-page visit, contact form, free-trial start | Demo request: 25–50 pts; pricing-page visit: 15–30 pts; contact form/free-trial start: >20 pts |
| Medium intent | Webinar attendance, case study download, product-page view | 5–15 pts |
| Low intent | Blog read, email open, social click | 0.5–3 pts |
Recalibrate quarterly. Also layer first-party signals with third-party intent data so buying readiness is easier to spot. Even a good weighting model drifts if no one updates it.
3. Static and Outdated Scoring Models
A scoring model that never gets updated goes stale. Buyer behavior changes. Campaigns change. Channels shift. Even your ICP can move. But fixed rules stay stuck in the past.
That’s the problem.
Rules based on old patterns turn into noise once those patterns stop lining up with conversion. So the score may look current, but it no longer tells you who is likely to buy.
Impact on MQL-to-SQL Conversion
Old models create both false positives and false negatives. Weak leads get pushed into MQL status, while strong buyers get missed or buried.
That shows up fast in conversion. MQL-to-SQL conversion averages about 13%, while well-tuned behavioral scoring can reach 39%–40%.
When the model is off, the handoff to sales gets weaker. And that usually spills into pipeline quality next.
Effect on Pipeline Quality
If scoring rules no longer match your current ICP, high-scored leads start stalling early. Deal sizes get smaller. Win rates fall.
This is score inflation in plain English: more MQLs, fewer real opportunities.
Pipeline volume may go up on paper, but opportunity quality drops. And once pipeline quality slips, forecast confidence usually slips with it.
Risk to Forecast Confidence
When high scores stop lining up with revenue, forecast accuracy falls and score tiers lose trust. Review meetings get tougher because the numbers are harder to defend.
Leading RevOps teams treat score governance as a forecasting control. They run quarterly checks on win rates and stage conversion by score tier, then recalibrate when high-score performance drops by more than about 20% versus prior periods.
RevOps Fix Priority
This is a high-priority fix when sales keeps calling out lead quality problems or forecasts are off on a regular basis.
Start with a simple audit of your last 20 closed-won and closed-lost deals. Look at which firmographic and behavioral signals actually lined up with revenue, then update the model based on that.
A simple review cadence works well:
| Review Frequency | Focus |
|---|---|
| Monthly | Pull leads scored about 90 days ago. Check MQL-to-SQL conversion, opportunity creation, and win rates by score tier |
| Quarterly | Full audit: revisit fit, weights, thresholds, and decay |
| Annually | Major refresh tied to fiscal planning, new markets, or ICP changes |
Recalibrate right away when high-score performance drops. If your high-score tier stops beating lower tiers, or sales keeps flagging misaligned leads, don’t wait for the next review cycle.
The next control is keeping stale scores from overstating buyer readiness.
4. No Negative Scoring, Decay, or Recency Controls
Even a decent model breaks when it doesn't age with the buyer. If scores only go up, the system is flawed from the start. A lead that clicked around six months ago can end up ranked next to someone who was active this week. Sales can't tell old interest from current intent, and the forecast gets blurred too.
Score decay lowers a lead's score over time when nothing new happens. Negative scoring removes points for low-intent or poor-fit actions, like unsubscribes, spammy form fills, free or personal email domains, visits to a careers page, or long stretches of inactivity. Recency controls give more weight to recent actions than older ones - for example, full points for activity in the last 7-30 days, partial points for 31-90 days, and almost no points after 90 days. Without all three, stale leads keep outranking active buyers.
Impact on MQL-to-SQL Conversion
When decay and negative scoring are missing, MQL counts stay high while SQLs trail behind. Missing these controls can each reduce conversion by 10-30% as scores drift away from what buyers are doing right now. Sales reps end up spending time on people who won't reply, and conversion slips. That drag usually shows up next in pipeline performance.
Effect on Pipeline Quality
Inside the CRM, the pattern is pretty clear: more open opportunities, little recent activity, deals stuck in early stages, and a long tail of records that age out and close lost. For a U.S. mid-market team, that can tie up tens or hundreds of thousands of dollars in pipeline value in deals that have little chance of closing. Once stale leads start piling up, forecast accuracy starts to slide too.
Risk to Forecast Confidence
If old engagement gets treated like current intent, forecasts start to overshoot. If old scores stay high, pipeline coverage looks better than it is. Then trust drops. The pipeline says things are fine, but closed-won numbers keep missing.
RevOps Fix Priority
Treat decay and negative scoring as required controls, not nice-to-have tuning. Look for high-score leads with no recent engagement, MQLs that stall out, and repeated forecast misses.
Keep firmographic fit separate from behavioral decay. Industry, company size, and role should stay stable and get refreshed through enrichment. Then make three changes:
- Apply decay to behavioral signals based on your actual sales cycle
- Subtract points for disqualifying actions with a negative scoring matrix built with sales
- Weight recent activity more heavily with recency bands tied to your pipeline stages
Set up decay, negative scoring, and recency rules in your scoring platform. These controls often reduce MQL volume, but they tend to improve SQL conversion and pipeline quality within one or two sales cycles.
5. Overcomplicated and Siloed Scoring Rules
Fixing decay and recency helps. But a score can still break down if the rule set gets too messy to explain, trust, or maintain.
That usually happens when marketing builds scoring on its own. The model starts small, then turns into a pile of overlapping rules that sales doesn't trust or use. At that point, the score may look precise, but it stops being useful. And when sales can't stand behind the score, MQL-to-SQL acceptance drops.
There's another issue here too. If marketing and sales use different definitions of qualification, the model ends up rewarding activity instead of sales-ready fit.
Impact on MQL-to-SQL Conversion
When reps can't tell why a lead scored high, they stop treating the score as a signal. That's why MQL-to-SQL acceptance rate is the clearest read on whether the model is doing its job. If sales keeps rejecting high-scored leads, the model is off.
Siloed scoring rules push this metric down because the score reflects marketing's logic, not the criteria sales uses to judge buying readiness.
Effect on Pipeline Quality
What follows is pretty predictable: more top-of-funnel volume, fewer solid opportunities, and lower win rates.
Risk to Forecast Confidence
Forecasting gets shaky when high scores don't turn into SQLs or closed-won revenue. If the logic behind the score isn't clear, pipeline reviews and forecast calls get harder to defend. The numbers end up reflecting engagement volume, not pipeline that has been checked and qualified.
RevOps Fix Priority
The fix is straightforward:
- Run a joint workshop with marketing and sales to define ICP fit and sales-qualifying behavior.
- Cut overlapping rules and low-signal triggers.
- Split the model into two layers: fit for firmographic match and engagement for behavioral intent.
- Test the revised model in parallel before changing routing.
- Switch only after MQL-to-SQL and win rates improve.
Track MQL-to-SQL acceptance rate as the main health metric. Then use sales rejection reasons to tune the rules on a set cadence.
Once the model is simpler, the next problem shows up fast: weak handoff and slow follow-up.
6. Weak MQL-to-SQL Handoff and Sales Follow-Up
Even the best score falls apart when sales doesn't move fast. And even a strong scoring model won't help if the handoff itself is messy. Analysis across 127 B2B SaaS companies found that 73% of MQLs are never contacted by sales. That's not a scoring issue. It's a process issue.
Impact on MQL-to-SQL Conversion
Speed matters here - a lot. Leads contacted within 5 minutes are up to 21x more likely to convert to SQL than leads contacted 30+ minutes later. But many B2B teams still move far too slowly. In fact, over 57% of first call attempts on inbound leads happen more than a week after the lead was created. At that point, intent has cooled off, and the buyer may already be talking to someone else.
Ownership problems make this worse. If routing sends a lead to the wrong rep or the wrong territory, follow-up can stall before it even begins.
Effect on Pipeline Quality
Late or misrouted follow-up also changes what gets into pipeline. Leads contacted late tend to show lower win rates and smaller deal sizes than similar leads reached on time. And sometimes reps create opportunities just to show activity, not because the buyer is showing clear interest. That leads to pipeline inflation that falls apart under review.
The result is a funnel shaped by who got reached first, not by who fits best. So the score can look broken when the real problem sits in the process.
Risk to Forecast Confidence
Forecasts built on MQL and SQL volume assume the follow-up process stays steady behind the scenes. But when that process swings from quarter to quarter - say, 70% of inbound MQLs get contacted within 5 minutes in one period, then only 20% in another - the same MQL volume can produce very different pipeline results. Only about 20% of sales teams forecast with more than 75% accuracy, and poor pipeline hygiene plus weak lead handoff are major reasons why.
If execution is this uneven, leaders can't put much faith in the inputs.
RevOps Fix Priority
The fix starts with four basics: definitions, SLAs, routing, and tracking. Write down who owns the MQL and what happens next. Set SLAs by lead type:
- Under 5 minutes for demo or pricing requests
- Under 1 hour for high-intent inbound leads
- Within 24 hours for lower-intent leads
Then automate CRM routing and task creation. Add alerts when an SLA gets missed. Every handoff should include the score breakdown, recent activity, and firmographic context.
You also need to track the right things: time from MQL creation to first sales activity, the share of MQLs contacted within SLA, and conversion rates by response-time bucket. If early-contact cohorts beat late-contact cohorts, fix the process before touching the score.
If response time is already tight, the next step is checking whether the score lines up with revenue outcomes.
7. Not Checking Scores Against Real Revenue Outcomes
Fit, intent, decay, and handoff sound good on paper. But none of them matter unless they help predict revenue. A score is just a hypothesis until it lines up with opportunity creation, win rate, and closed-won revenue. Once follow-up is in place using marketing automation, this is the next thing to test.
Impact on MQL-to-SQL Conversion
When scores haven't been checked against revenue, teams tend to send engaged but low-converting leads to Sales. That drags down acceptance rates and buries real buyers under weaker ones. Sales starts rejecting more leads, conversion rates slip, and tension builds between Marketing and Sales. At the same time, actual buyers can get too little weight and reach the wrong queue too late.
Effect on Pipeline Quality
Unchecked scoring can make MQL volume look better without making pipeline better. One HR consultancy cut leads sent to Sales by 52% and increased revenue by 41% in less than a year. Results like that come from tying scores to revenue data, not from sending more names downstream.
Risk to Forecast Confidence
If score thresholds don't track with bookings, the forecast is built on noise. In RevOps terms, score tiers need to show clear differences in revenue performance. High-score leads should beat lower-score leads on win rate and deal size on a steady basis. If they don't, the model isn't doing its job.
RevOps Fix Priority
Put leads into score bands, then compare each band using a fixed 30-, 60-, or 90-day lookback window. Check:
- opportunity creation rate
- win rate
- average deal size
- closed-won revenue
If low-score leads close at the same rate as high-score leads, recalibrate. If high-score leads are producing weak pipeline, the weights are off. That score-band view helps separate actual buying signals from plain scoring noise.
ICP Fit Rules: Broad vs. Refined
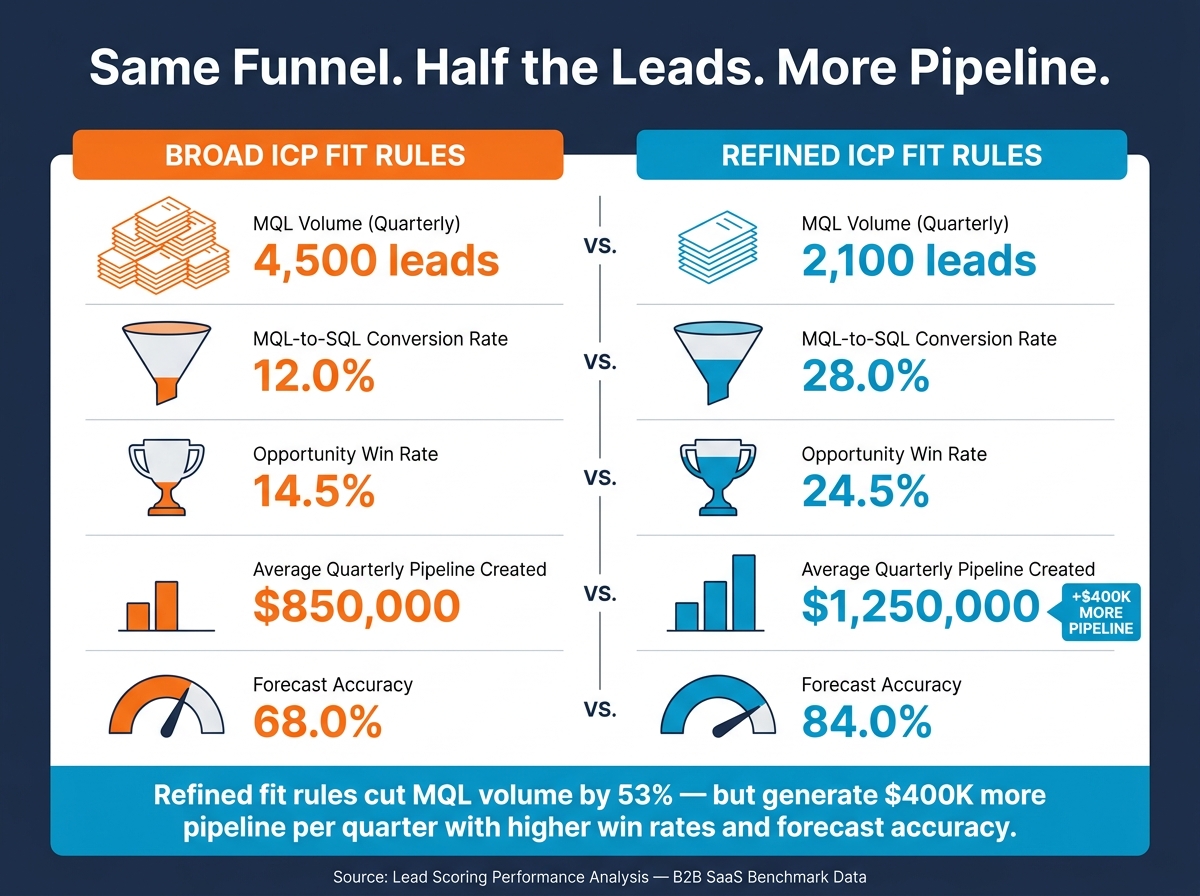
Lead Scoring: Broad vs. Refined ICP Fit Rules - Pipeline Impact
Broad fit rules usually make MQL numbers look bigger. Refined fit rules tend to turn into more sales.
The table below shows the tradeoff between broad and refined fit rules.
| Metric | Broad ICP Fit Rules | Refined ICP Fit Rules |
|---|---|---|
| MQL Volume (Quarterly) | 4,500 leads | 2,100 leads |
| MQL-to-SQL Conversion Rate | 12.0% | 28.0% |
| Opportunity Win Rate | 14.5% | 24.5% |
| Average Pipeline Created (Quarterly, USD) | $850,000 | $1,250,000 |
| Forecast Accuracy | 68.0% | 84.0% |
The headline is simple: refined fit lowers MQL volume, but it improves SQL conversion, win rate, pipeline created, and forecast accuracy.
That MQL drop can look rough at first glance. But the refined column creates $400,000 more in average quarterly pipeline with roughly half the leads. That’s the point. You’re not chasing more leads for the sake of it. You want more sales chances from each lead that enters the funnel.
It helps to keep fit and intent separate. Fit tells you who should be in the funnel. Intent tells you when to act.
Fit is the first gate. Decay is what keeps qualified leads current.
Score Decay and Negative Scoring: With vs. Without
Here’s the clearest before-and-after view of stale scoring. This side-by-side check shows whether your scoring model is keeping up with buyer intent - or drifting away from it.
Without decay and negative scoring, old activity keeps inflating lead scores. That creates noise in the funnel and puts weak leads in front of sales. The result is pretty simple: more volume, less signal.
| Metric | No Decay / No Negative Scoring | Decay and Negative Scoring |
|---|---|---|
| Inactive leads above MQL threshold | 40–60% of the MQL pool | Drops to 10–20% of the MQL pool |
| SDR workload (MQLs/week) | ~70 MQLs, with ~35–40 stale leads | ~35–45 MQLs, with 80–90% recently active |
| SAL acceptance rate | 40–55% | 65–80% |
| Pipeline reliability | Frequent forecast misses | Higher forecast accuracy and board confidence |
The pattern is hard to miss: fewer, fresher leads usually book more meetings than a bigger stale pool.
A simple setup works well here:
- Use a negative-scoring matrix for clear disqualifiers.
- Decay behavioral scores on a 30-day cadence.
RevOps Tools and Resources Worth Checking
Once you’ve checked score bands against revenue, the next step is putting them to work. The goal is simple: use tools that enforce fit, intent, decay, and routing without adding more noise.
Your stack should match the part of the funnel that’s failing. If the problem is a stale scoring model, predictive scoring tools like HubSpot and Salesforce Einstein can retrain on closed-won data. That helps teams move past static models that stop reflecting what sales is now closing.
If weak fit logic is the issue, MadKudu is worth a look. It separates fit and intent into different score fields, which makes routing a lot cleaner. High-fit leads can go to sales, while lower-fit leads can move into nurture instead.
For lifecycle control, Marketo and HubSpot can handle scoring, routing, recycling, and disqualification. And if your team is missing intent signals or working with thin firmographic data, enrichment and intent-data tools can fill in the behavioral inputs that rules-based models often miss. 6sense and Leadspace are two examples to review in that group.
When you assess a tool, don’t stop at lead volume. Check whether it improves the numbers that matter:
- MQL-to-SQL
- SAL acceptance
- Win rate by score band
- Score accuracy
- Conversion rate
- Cycle time
That’s the test. If a tool doesn’t help conversion, acceptance, win rate, or forecast accuracy, it’s probably just adding motion instead of fixing the funnel.
If you need a shortlist, use a curated directory of funnel and RevOps tools. Marketing Funnels Directory lists funnel tools, lead scoring platforms, and RevOps vendors, including a section for mid-market and PE-backed operators.
One more thing: if key firmographic fields are less than 50% complete, fix enrichment first. Scoring incomplete data just pushes noise upstream.
Choose tools that improve conversion, acceptance, and forecast accuracy - not just lead volume.
Conclusion
Most pipeline issues come from scoring and handoff, not a lack of lead volume. Put another way, a lot of pipeline gets lost because teams score the wrong signals, route leads too slowly, or send sales leads that never had a real shot in the first place.
Treat the seven mistakes in this article like a final audit checklist. Sit down with RevOps, sales, and marketing and review fit rules, intent weights, decay, handoff SLA, and revenue correlation. Those are the controls that matter most: fit, intent, decay, simplicity, handoff, and revenue validation.
When teams fix scoring and handoff together, qualified pipeline often improves fast. And if your score tiers don't map to different revenue outcomes, that's a clear sign the model needs work.
Start with last quarter's closed-won deals. Review them this week, then pick one scoring fix and one handoff fix to put in place within 30 days.
Reliable pipeline comes from scores that predict bookings, not just MQLs.
FAQs
How do I know if our lead scoring model is hurting pipeline?
Check for clear performance gaps. Compare the average scores of your last 50 closed-won deals with 50 closed-lost deals. If the gap is under 20 points, the model may not be doing a good job of separating real buyers from noise.
Other warning signs include:
- MQL rejection rates above 30%
- Low-scoring leads turning into closed-won deals, or high-scoring leads converting worse than lower-tier leads
- A-tier leads converting less than 3 to 5 times better than C-tier leads
What should count more in lead scoring: fit or intent?
In B2B lead scoring, don’t treat fit and intent like an either-or choice. You need both.
Fit is the baseline. It answers a simple question: can this lead actually buy from you?
Intent tells you something different: are they showing interest right now, and how urgent does that interest look?
Start with fit first. That keeps your team from spending time on leads that were never a match in the first place.
But once that baseline is in place, the better-performing models usually put more weight on behavior and intent signals. That’s what helps you tell the difference between someone who’s just looking around and someone who may be close to a buying decision.
How often should we update our lead scoring model?
Review and update your lead scoring model at least quarterly so it stays in step with market shifts and sales results. Many teams also do monthly check-ins to look at conversion data and fine-tune point values.
You should also review it right away if conversion rates drop, lead quality gets worse, or the market changes in a major way.