If I had to boil this down to one line, it’s this: B2B lead scoring works when I rank leads by fit, intent, and timing - then hand off only the ones sales should contact now.
Without that, reps can waste 40%–60% of their time on leads that were never likely to buy. And teams with weak qualification rules often sit near a 13% MQL-to-SQL conversion rate, while top teams land closer to 25%–35%.
Here’s the short version of what matters most:
- I start with ICP fit, using closed-won customer data
- I score the buying committee, not just one contact
- I keep fit and behavior separate
- I give more weight to high-intent actions like demo requests and pricing-page visits
- I set clear score thresholds for handoff, nurture, and sales follow-up
- I use time decay so old activity loses weight
- I add account-level scoring to spot group interest across 6 to 10 stakeholders
- I review the model every quarter to cut drift and keep sales buy-in
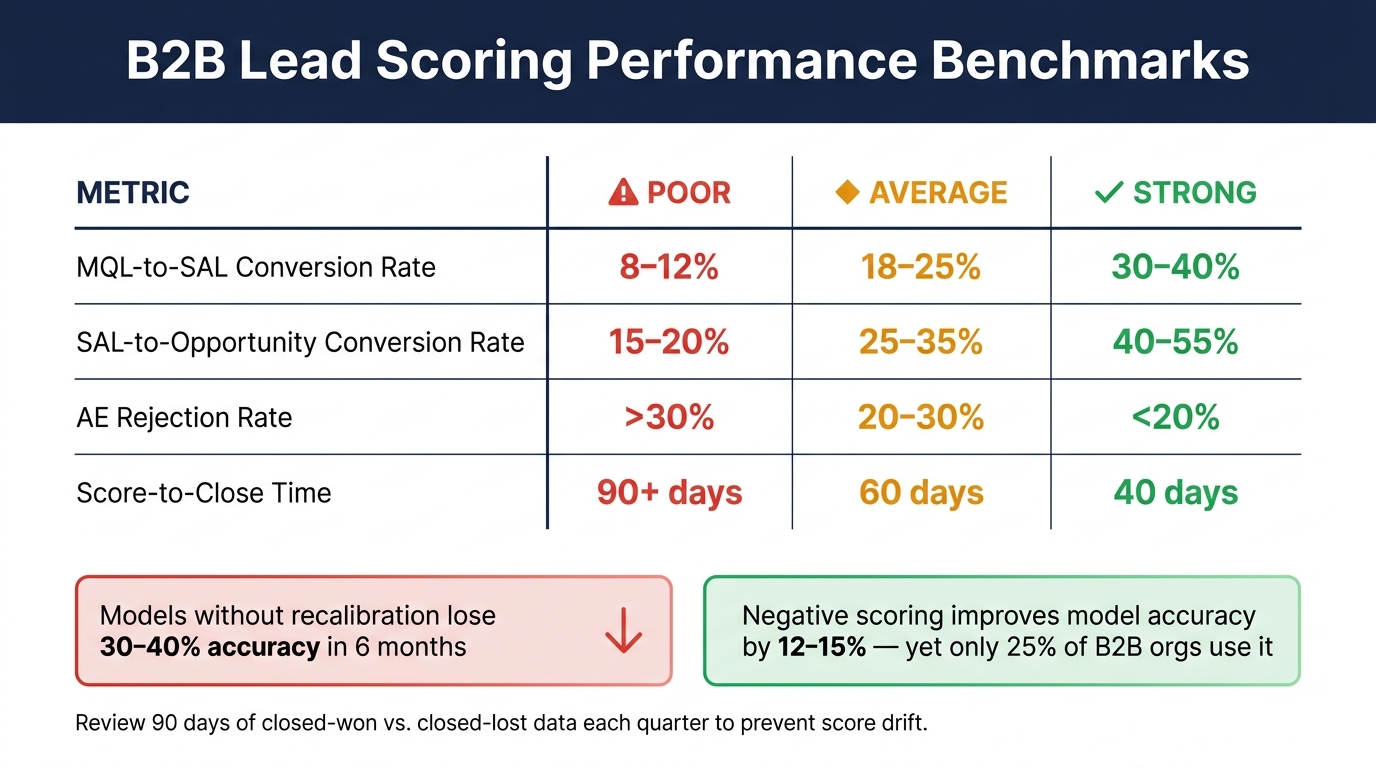
B2B Lead Scoring Performance Benchmarks: Poor vs. Average vs. Strong
Advanced Lead Scoring Techniques for B2B Tech Companies
sbb-itb-a84ebc4
Quick comparison
| Practice | What I focus on | Why it matters |
|---|---|---|
| Define ICP and buying committee | Firmographics, title, disqualifiers | Stops bad-fit leads from reaching sales |
| Balance fit and behavior | Separate scoring tracks | Shows who can buy and who wants to buy now |
| Set thresholds with sales | Shared rules, SLA, handoff score | Cuts lead rejection and confusion |
| Build into the tech stack | CRM fields, alerts, routing, shadow mode | Makes scoring part of daily sales work |
| Apply decay and recency | Half-life, inactivity penalties, repeat visits | Keeps stale leads out of the queue |
| Add account context | Multi-contact and multi-team engagement | Finds buying activity at the company level |
| Measure and refine | Conversion by tier, rejection rate, score gap | Keeps the model accurate over time |
In other words: the goal is not more leads. It’s a cleaner call list, faster follow-up, and better sales focus.
What a Strong B2B Lead Scoring Model Should Do
A strong lead scoring model turns a messy list of leads into a prioritized queue. That way, sales reps can spend their time on the 15% to 20% most likely to buy. Put simply: it gives sales a clear call list instead of a pile of names.
That priority list only helps if it leads to fast follow-up. Timing matters. When a lead crosses the handoff threshold, the model should send a real-time alert so a rep can reach out within 2 to 4 hours.
But speed alone won’t fix a broken process. Sales and marketing also need the same rule for what counts as qualified. A strong MQL-to-SQL process sets a minimum fit threshold and helps keep MQL-to-SQL acceptance above 60%. When the two teams use different rules, things go sideways fast. Acceptance rates drop, and the pipeline fills up with engaged leads that were never a good fit in the first place.
Done well, scoring helps reps start with the right accounts first. That can shorten sales cycles and improve lead-to-opportunity conversion by building more effective funnels.
Here are the core terms used throughout this guide:
| Term | What It Means |
|---|---|
| ICP (Ideal Customer Profile) | The blueprint of your most valuable customers, based on demographic and firmographic traits. |
| MQL (Marketing Qualified Lead) | A lead that has reached a score threshold and is ready for sales review. |
| SQL (Sales Qualified Lead) | A lead that sales has vetted and accepted as a real opportunity with budget and timeline. |
| Fit Signals | Explicit data like job title, seniority, company size, industry, and geography. |
| Behavior Signals | Actions that reveal intent, such as pricing page visits, case study downloads, or demo requests. |
| Account Scoring | Aggregating scores across multiple contacts at one company to measure total buying committee engagement. |
Use these terms the same way across the seven practices below. With the basics in place, the next section walks through how to build the model.
1. Define Your Ideal Customer Profile and Buying Committee
Build your scoring model around the customers that actually turn into closed-won deals. In B2B, fit should matter just as much as engagement. If someone is a bad fit, their clicks, downloads, and page views can look good on paper but do nothing for pipeline.
Start with your closed-won deals from the last 12 to 24 months. Look for patterns you can spot again and again: industry, company size, revenue range, technology stack fit, and geography. That closed-won data should come first. Then score each new lead against that pattern.
Set a minimum ICP score and stick to it. If a lead falls below that line, keep them in nurture. High engagement without ICP fit is still a distraction and can burn rep time fast.
Also, score the buying committee, not just the person who filled out the form. Title matters because different roles shape the deal in different ways. Executives should get the most weight, followed by VPs and directors, then individual contributors. On the flip side, use disqualifiers to screen out leads that are unlikely to convert at all. That can include competitor domains, personal email addresses, or titles that don't match your buyer profile.
Here’s what that can look like in practice:
| Signal Category | Examples | Point Range |
|---|---|---|
| Firmographic | Industry match, company size (100–500 employees), revenue ($10M+), geography | +15 to +30 |
| Demographic | VP/C-level title, job change to a target role | +30 to +40 |
| Technographic | Uses complementary technology, uses a competitor tool | +10 to +15 |
| Intent Signals | Recent funding round, new VP-level hire, hiring spikes | +10 to +15 |
| Disqualifiers | Competitor domain, personal email (@gmail.com), "Student" title | -10 to -25 |
A common problem is that marketing-only scoring models chase MQL volume instead of SQL conversion. That often leads to rejection rates above 30%. Sales needs to co-own the weights and threshold, because reps know which roles and account types tend to close.
Once the ICP is set, the next move is to decide how much fit should matter compared with behavior.
2. Balance Fit and Behavior With Clear Scoring Rules
Once your ICP is set, the next step is simple: decide how much behavior should matter compared with fit.
Split lead scoring into two separate parts: fit and intent. Keep them apart so the score shows both qualification and urgency. Then assign points based on signal strength, not just activity volume.
A single blended score doesn't tell you much if you can't see why it got there. Fit answers, "Can they buy?" Behavior answers, "Are they interested right now?" The point isn't to build a perfect score. It's to make handoffs clearer for sales.
High-performing models put more weight on behavior than fit. Fit works as the baseline. It filters out leads that aren't able to buy. But behavior is what separates a mildly curious contact from someone who is actively looking at a purchase.
That means your main intent signals should come from deliberate actions, not passive activity. Use a simple scoring model like this to keep things steady across reps and campaigns, similar to the systems in The Ultimate Sales Machine.
| Action | Score | Rationale |
|---|---|---|
| Demo Request | +50 | Explicit buying signal |
| Pricing Page Visit | +30 | Direct purchase research |
| Case Study Download | +20 | Evaluating social proof |
| Webinar (Product-focused) | +15 | Active learning |
| Blog Post Read | +3 | Passive interest |
Email opens are weak signals, so clicks and on-site actions should matter more. And if someone comes back to your pricing page or demo page more than once, that usually tells you more than a single visit.
There's another issue that trips teams up: score inflation. A lead that was active months ago can keep a high score and clog the sales queue. That's a problem. Behavioral intent fades fast, so add time decay so recent activity counts more than older engagement.
Once fit and intent are weighted, align the score with sales handoff rules.
3. Align Lead Scoring With Sales and Set Clear Score Thresholds
Marketing-only scoring falls apart fast. If Sales doesn’t help shape the rules, rejection rates tend to climb. And once Sales has a say, the next move is simple: decide the exact score where a lead gets handed off.
Create a Sales-Marketing-RevOps scoring group. Marketing can suggest point values based on data, but Sales should approve which actions show real buying intent and handoff readiness. That keeps the conversation focused on governance: who sets the rules, how they’re reviewed, and who gives final sign-off.
Set your threshold at the point where conversion jumps in your historical data. That’s the score where the handoff should happen. Not a fuzzy range. Not a “close enough” call. One clear rule.
One recent analysis found that raising the MQL threshold led to better MQL-to-SQL conversion and cut down on weak leads.
| Lead Score | Status | Sales Action |
|---|---|---|
| 75–100+ | Sales-ready | Assign to SDR/Sales; follow up within 2 hours |
| 50–74 | Nurture | Enroll in fast nurture or personalized content tracks |
| 25–49 | Long-term nurture | Automated marketing sequences |
| < 25 | Awareness | Basic marketing awareness only; no sales intervention |
A solid MQL threshold should capture the top 15% to 20% of your database. And your MQL-to-SQL acceptance rate should stay above 60%.
One more thing: score the person, not the form submission. A lead isn’t just one webinar signup or one ebook download. It’s the full pattern of behavior over time.
Both teams should also write down the agreed thresholds and response times in a formal SLA. That way, fast follow-up is part of the system, not something people hope happens.
After the handoff is defined, build it into your CRM and automation tools.
4. Build Lead Scoring Into Your Tech Stack
Once you set your thresholds, plug lead scoring into the CRM and automation tools your reps already use every day. If a score doesn't change what a rep does next, it's just decoration.
Start with CRM-native scoring, then add enrichment and intent data on top. Keep the score inside the CRM and sync updates back to the contact or account record. Add lead score fields to the CRM, then show them in dashboards and list views so reps can spot top-priority prospects right when they need to make a call or send a follow-up.
A simple setup usually works best:
- Use the CRM score as the base
- Layer in fit, enrichment, and intent signals
- Display the score where reps already work
- Sync score changes back to the record
Before you turn the model on for routing, run it in shadow mode for 14 days. That means leads get scored, but the score doesn't change routing yet. It's a low-risk way to check your threshold logic before it starts shaping the sales pipeline.
Pay close attention to missing fields. If job title, industry, or company size aren't there, fit scores can drift off course. And don't let old activity sit at the top forever. Add score decay so stale engagement fades over time. After the model goes live, adjust how much weight recent activity should carry.
One more thing: keep the model to 5 to 8 active variables. Once you pile on too many signals, accuracy tends to slip.
5. Apply Time Decay, Recency, and Frequency to Reflect Buyer Intent
Once your scoring model is set up, decay is what keeps it honest. A pricing page visit from last Tuesday does not mean the same thing as one from five months ago. The key here is to focus on how to apply decay, not just why it matters.
Use this formula:
score = raw_points * 0.5 ^ (days_since_activity / half_life)
For most B2B sales cycles, a 14-to-30-day half-life is a solid range. So if a demo request is worth 50 points, that score drops to about 25 points after 30 days of inactivity. Not every action should fade at the same rate, though. Research signals, like case study downloads, can decay more slowly because they often show evaluation behavior instead of immediate buying intent.
After decay, look at the pattern, not just the total. Prioritize recency and frequency over raw volume. Three pricing page visits in 48 hours tell you a lot more than 15 blog reads spread across six months. The same goes for sequence. A blog-to-case-study-to-pricing-page path suggests intent is building. That helps sales reps spend time on buyers with current momentum instead of stale activity.
You also need inactivity penalties. Without them, old engagement keeps scores inflated and clogs the queue. Only 25% of B2B organizations currently subtract points for silence, yet that step improves model accuracy by 12% to 15%. A simple setup works well:
- Reduce behavioral score by 20% to 25% after 30 days
- Cut it by 50% after 60 days
- Reset it to zero after 90 days
- Archive or suppress contacts at 180 days to protect deliverability
There’s one catch: most CRM-native tools need custom automation or AI modules to handle decay. Most platforms don’t support it out of the box. If exponential decay isn’t possible in your system, use fixed percentage drops instead. Either way, decay only matters if it changes routing and follow-up inside the CRM.
Decay sharpens contact scores. The next move is to layer in account-level context.
6. Add Account-Level and Buying Group Context to Your Scores
Contact scores show person-level interest. Account scores show whether the company is moving. In B2B, that gap matters because the average buying committee includes 6 to 10 stakeholders. If your model tracks only one person at a time, you miss a big chunk of what’s going on. Sales needs to see intent at the account level, not just at the contact level.
The move here is simple: roll up individual engagement into one account-level score inside your CRM. That helps you spot high-intent accounts even when no single person has crossed your MQL threshold yet, but the total activity points to an active buying cycle.
Not all activity should count the same. A visit from a C-level leader or VP should carry more weight than activity from a junior contact. And when people from multiple departments engage at the same time, that deserves extra points. Why? Because cross-functional activity usually means the deal has moved past casual interest and into group evaluation.
The table below shows which account-level signals to track and how to weight them:
| Account-Level Signal | Points | Why It Matters |
|---|---|---|
| 3+ people engaged (last 90 days) | +20 | Broad buying committee interest |
| Pricing page visited by anyone at the account | +10 | Active cost evaluation in progress |
| Security/compliance page visited | +10 | Late-stage signal, especially for enterprise |
| RFP/RFI received | +30 | Explicit intent to evaluate vendors |
| Procurement contact engaged | +15 | Deal moving toward a formal purchase |
| 3+ departments engaged | +25 | Cross-functional organizational buy-in |
This only works if your systems can tie contact activity and account activity together. Your CRM, marketing automation platform, enrichment tools, identity resolution, and intent data sources need to feed the same scoring view. That way, the account score reflects both known and anonymous traffic.
Use the same recency rules here too, so old group activity doesn’t make demand look stronger than it is. And don’t treat every contact the same. Senior decision-makers should carry more weight than junior staff. On the flip side, subtract points for competitor domains or poor-fit companies so weak accounts don’t look hotter than they are.
7. Measure Results and Refine Your Model Over Time
Once your model goes live, the job changes. Now it's about maintenance.
A lead scoring model is not something you set once and leave alone. It drifts. And if you skip recalibration, accuracy can fall by 30–40% in six months. When that happens, sales starts working from old signals, and the pipeline slowly fills with the wrong leads.
A simple way to check performance is the gap test. Pull your last 50 closed-won and 50 closed-lost deals, then compare their average scores. A healthy model should show at least a 20-point gap between those two groups. If the gap is smaller, your scoring system probably isn't separating actual buyers from noise.
You should also keep a close eye on AE rejection rate. If sales is pushing back on more than 20–30% of MQLs, your model is tuned for volume instead of quality. That's usually a threshold issue. In plain English, the cutoff you set in Section 3 may no longer fit how leads behave now.
Conversion rates by score tier tell you a lot too. A-tier leads should convert at 3–5x the rate of C-tier leads. If that isn't happening, the tier boundaries aren't doing much work.
Use these benchmarks to spot drift fast:
| Metric | Poor | Average | Strong |
|---|---|---|---|
| MQL-to-SAL Conversion | 8–12% | 18–25% | 30–40% |
| SAL-to-Opportunity Conversion | 15–20% | 25–35% | 40–55% |
| AE Rejection Rate | >30% | 20–30% | <20% |
| Score-to-Close Time | 90+ days | 60 days | 40 days |
Each quarter, review 90 days of tiered conversion data. Compare score distributions across closed-won and closed-lost deals, and test one variable at a time so you can see what changed and why. That matters more than most teams think. If you change too many things at once, it's like trying to fix an engine while swapping every part at the same time.
One more detail is easy to miss: negative scoring. Only 25% of B2B organizations use it, yet it improves model accuracy by 12–15%.
The next step is turning these score insights into practical tools and templates.
Tables and Examples to Put the Model Into Practice
These tables turn the model into something your team can use day to day: score leads, route them fast, and trim old activity before it distorts the picture.
Fit vs. Behavior Scoring
This first table separates who the lead is from what the lead does. That matters because a perfect-fit account with no action isn't the same as a low-fit contact showing strong buying intent.
| Category | Criterion | Points | Notes |
|---|---|---|---|
| Fit | Annual Revenue: $10M–$100M | +25 | Indicates budget availability |
| Fit | Job Title: VP, Director, or C-Level | +30 | Decision-making authority |
| Fit | Industry: Target Vertical (e.g., SaaS, FinTech) | +25 | High alignment with product use cases |
| Behavior | Demo Request Submission | +50 | Explicit high-intent signal |
| Behavior | Pricing Page Visit (3+ minutes) | +20 | Active cost evaluation |
| Behavior | Email Engagement (3+ clicks in 30 days) | +10 | Sustained interest in marketing communications |
| Negative | Competitor or Personal Email Domain | -50 | Strong non-buyer indicator |
A lead can build points from both fit and behavior, while negative signals pull the score back down. So if someone looks perfect on paper but comes in through a personal email address, that should slow the handoff.
Score Bands and Handoff Rules
Once the score is set, the next step is simple: route it based on urgency. This keeps sales and marketing from guessing.
| Score Range | Lead Tier | Action | Response SLA |
|---|---|---|---|
| 75–100 | Hot (SQL) | Direct AE outreach | < 2 hours |
| 50–74 | Warm (MQL) | SDR qualification call or personalized email | < 24 hours |
| 0–49 | Cold / Nurture | Automated nurture sequence | Marketing-owned |
The logic here is pretty straightforward:
- 75–100 means the lead has both fit and intent, so an AE should step in fast.
- 50–74 means there’s promise, but the lead still needs a check from an SDR.
- 0–49 means the contact stays in nurture until new signals show up.
Time Decay in Practice
Lead scores can drift if old actions keep too much weight. A demo request from today does not mean the same thing as one from a month ago. That’s why a 25% monthly decay rate helps keep scores tied to current intent.
| Action | Base Points | Value on 06/15/2026 | Value on 05/15/2026 | Decision |
|---|---|---|---|---|
| Demo Request | 50 | 50 | 37.5 | Active: Follow up immediately |
| Pricing Page Visit | 30 | 30 | 22.5 | Drop: Move to nurture if no new activity |
| Webinar Attendance | 20 | 20 | 15.0 | Requalify: Trigger re-engagement email |
| Whitepaper Download | 10 | 10 | 7.5 | Nurture: Low priority |
This is where scoring gets more useful in practice. Without decay, older engagement can make a lead look hotter than it is. With decay, the score reflects what's happening now, not what happened weeks ago.
Use these tables as the operational baseline for the tools and workflows that follow.
Tools and Resources to Help You Get Started
Once the model is set, the next move is simple: pick tools that can run it without making a mess.
Your data volume should guide how you score leads. If you have fewer than 500 closed deals, start with rule-based scoring inside your CRM. It’s the simpler route, and it makes more sense at that stage. Shift to predictive scoring only when you have at least 1,000 lead records and 200 closed-won deals.
It also helps to bring in a visitor identification tool and a third-party intent-data source early. For example, you might use Leadfeeder for anonymous visitor data, and Bombora or G2 for buying signals.
As you compare tools, focus on a few features that matter most:
- Score decay
- Firmographic enrichment
- MQL-to-SQL tracking
- A visual rule builder
You can also use Marketing Funnels Directory to find B2B funnel tools, vendors, courses, and books.
Conclusion
Put these seven practices together, and the model actually gets simpler, not harder to manage.
Start with a small set of criteria based on closed-won data. Then shape it with input from sales. That part matters more than a lot of teams think. As Daniel Sims of VanillaSoft says, a scoring model built without sales buy-in gets ignored.
Most models break down for two plain reasons: drift and low sales trust. If a model sits untouched, its accuracy drops fast. And if reps can’t explain a score, they won’t use it. That kind of clarity is what turns lead scoring from a reporting task into something sales uses every day.
A good rule of thumb is simple: review 90 days of closed-won and closed-lost data each quarter, then adjust the weights. That steady habit can help teams beat the 13% median MQL-to-SQL rate. The aim isn’t a fancy model. It’s a model sales trusts and uses.
FAQs
How do I choose the right MQL threshold?
Choose it by looking at your last 12 months of lead data and spotting the point where lead-to-SQL conversion jumps. For many B2B teams, that lands between 60 and 75 points on a 100-point scale.
Use data instead of gut feel, and check the cutoff with sales. Set it too low, and weak leads slip through. Set it too high, and you may leave pipeline on the table.
When should I use account-level scoring?
Use account-level scoring when your sales approach is account-based, especially in enterprise sales or ABM.
It lets you judge engagement across the whole company instead of zeroing in on one person. That matters because big deals rarely hinge on a single contact. You’re usually dealing with a group of people, each with a different role in the buying process.
How often should I update my lead scoring model?
Update your lead scoring model at least once every quarter. Some sources also suggest checking it monthly.
You may need to make changes sooner, especially if conversion rates start to fall or the market shifts in a big way.