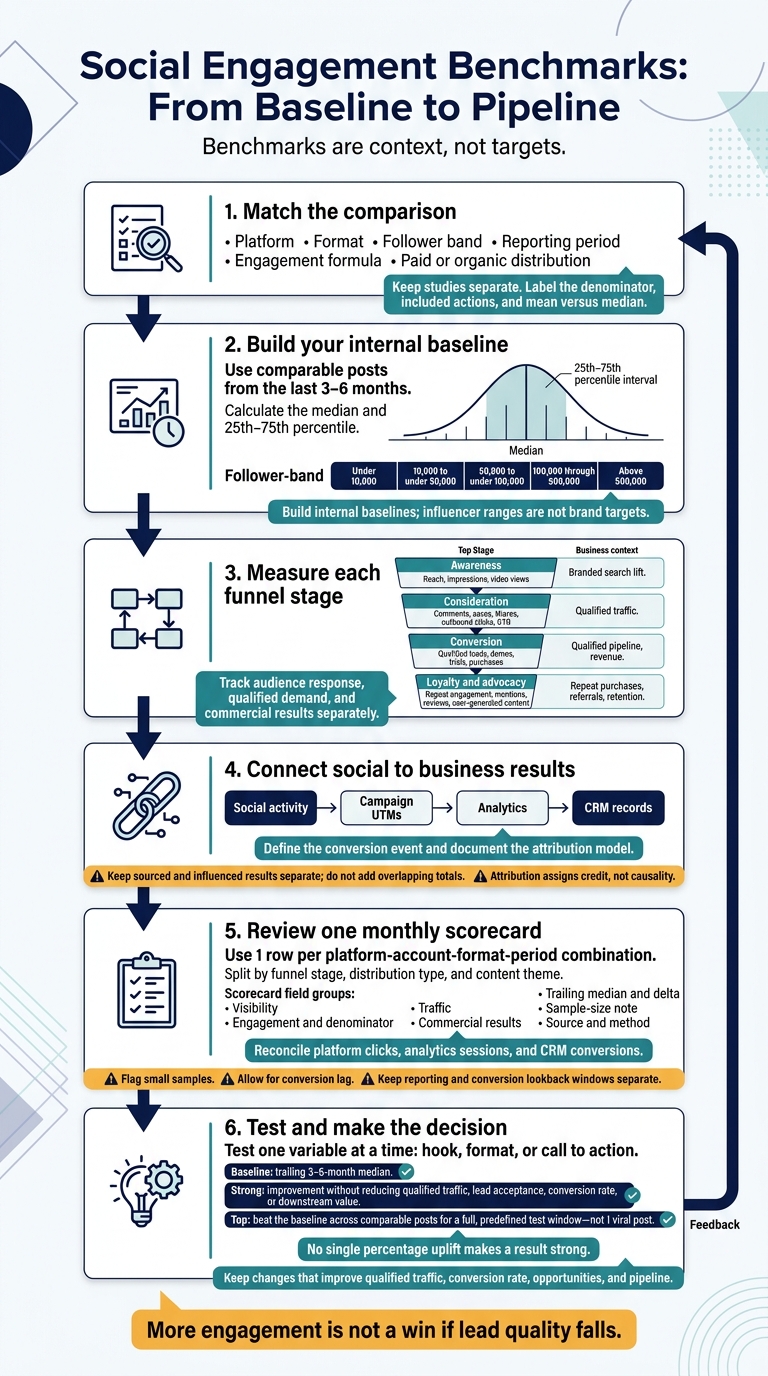
I use social engagement benchmarks as context, not targets. For decisions, I start with the median from your last 3-6 months of comparable posts, then check whether better engagement leads to qualified traffic, leads, and pipeline.
The cited 2025 Socialinsider study reports average engagement rates of 3.70% for TikTok and 0.48% for Instagram, using 2023-2024 posts. Those figures are historical reference points, not October 2026 performance standards.
Here’s how I put benchmarks to work:
- Match the comparison: Use the same platform, format, follower band, reporting period, engagement formula, and paid or organic distribution.
- Measure each funnel stage: Track reach for awareness, clicks and saves for consideration, and qualified leads and revenue for conversion.
- Check the business result: Connect social activity to analytics and marketing funnel software records through UTMs and defined conversion events.
- Review monthly: Use one scorecard, flag small samples, allow for conversion lag, and test one change at a time.
My rule: <u>more engagement is not a win if lead quality falls.</u>
Social Engagement Benchmarks: From Baseline to Pipeline
Engagement Benchmarks by Platform
Verify Published Rates and Ranges
Use the latest verified source for each platform, and keep studies separate. Before comparing benchmarks, apply the engagement definition from the previous section. Match each benchmark to the funnel role that platform serves best.
| Platform | Published rate | Publication year | Sampling period and sample | Included actions | Denominator/formula | Funnel use |
|---|---|---|---|---|---|---|
| Adobe’s 2025 benchmark classifies 3%–3.5% as good | 2025 | See source note | Not stated | Not stated | B2B awareness, expertise, consideration, lead generation | |
| 0.48% average (Socialinsider) | 2025 | 2023–2024; 125 million posts across the study | Likes and comments | (Likes + comments) ÷ followers × 100 | Awareness, consideration, product education, retargeting signals | |
| 0.15% average (Socialinsider) | 2025 | 2023–2024; 125 million posts across the study | Reactions, comments, and shares | (Reactions + comments + shares) ÷ page fans × 100 | Reach, community engagement, consideration, customer communication | |
| TikTok | 3.70% average (Socialinsider) | 2025 | 2023–2024; 125 million posts across the study | Likes, comments, shares, and saves | (Likes + comments + shares + saves) ÷ followers × 100 | Discovery, awareness, demand creation, upper-funnel growth |
| X | 0.12% average (Socialinsider) | 2025 | 2023–2024; 125 million posts across the study | See source note | Not stated | Conversation, news reaction, brand consideration, customer support |
Source notes: The retrieved LinkedIn excerpt does not state the sampling period, sample, included actions, or formula. The retrieved X excerpt does not specify the included actions or denominator/formula.
Do not combine benchmarks from different studies, periods, or statistic types into a single range. Platform averages are useful only when you understand how the source calculated them.
Why Platform Benchmarks Differ
| Factor | Effect on the reported rate | Reporting rule |
|---|---|---|
| Denominator | Follower-based rates measure response relative to the audience base; reach-, impression-, or view-based rates measure response to delivered content | Never compare rates with different denominators without labeling them |
| Included actions | Adding saves, shares, clicks, or video completions can change the numerator and increase the rate by a large amount | Reproduce the source’s interaction definition exactly |
| Industry mix | Content and audience behavior differ by industry | Compare against the same industry where possible |
| Account size | Large accounts often differ from small accounts in reach, posting patterns, and interaction rates | Segment benchmarks by follower bands |
| Distribution type | Organic posts, paid-supported posts, algorithmically recommended videos, and employee-amplified content reach different audiences | Separate organic, paid, and blended results |
| Sampling period | Platform algorithms, audience habits, and product features change over time | State the exact sampling period; do not label older findings as current |
| Mean versus median | Viral posts can pull averages upward; medians better represent the typical account or post | Identify whether the source reports a mean, median, or weighted average |
| Unit of analysis | Post-level averages, account-level medians, and industry-level aggregates answer different questions | State whether the statistic is calculated per post, per account, or across all interactions |
Mean and median are not interchangeable. Rival IQ’s 2025 report analyzed more than 4 million posts across Facebook, Instagram, TikTok, and X and reported median engagement rates. Socialinsider’s cited 2025 study analyzed 125 million posts and reported platform averages.
For funnel decisions, assess LinkedIn through professional relevance and lead-generation interest. Evaluate TikTok through discovery signals, such as watch time and completion rate, and Instagram through awareness and consideration signals. Then compare these platform baselines by post format and follower band.
sbb-itb-a84ebc4
Engagement Benchmarks by Format and Audience Size
Metrics and Baselines by Post Format
Compare formats on the same terms: platform, audience band, time period, and engagement formula. Use one formula throughout this section to keep format benchmarks comparable.
| Format | Platform examples | Sourced baseline | Relevant signal | Funnel role |
|---|---|---|---|---|
| Short-form video | Instagram Reels, Facebook Reels | Instagram Reels: 0.52%; Facebook Reels: 0.18%. | Average watch time, completion rate, rewatches, shares, saves, comments, profile visits | Awareness, education, consideration |
| Carousels and native documents | Instagram carousels, LinkedIn native documents | Instagram carousels: 0.55%; LinkedIn native documents: 7%. | Saves, shares, comments, swipe-through behavior, profile visits | Education, consideration, demand capture |
| Static images | Instagram, Facebook, LinkedIn | Instagram images: 0.37%; Facebook images: 0.15%; LinkedIn image posts: 5.3%. | Reactions or likes, comments, saves, shares, profile visits | Awareness, proof points, community engagement |
| Text posts | Facebook status posts | Facebook status posts: 0.20%. | Comments, replies, shares, profile visits | Point of view, community, consideration |
Note: Label each benchmark as a mean, median, percentile, or range, and state its denominator. Compare rates only when the formulas match. If a format has no direct published match, use an internal median.
Report engagement, completion, and clicks separately. Then use the format baselines to set targets by account size.
Compare Accounts by Follower Count
Audience size affects engagement rates. Use the same comparison method across follower bands, but don’t treat influencer ranges as brand targets. Build internal baselines for each follower band instead.
Use comparable posts from the last 3 to 6 months to calculate the median and 25th–75th percentile. Group accounts into these follower bands:
- Under 10,000
- 10,000 to under 50,000
- 50,000 to under 100,000
- 100,000 through 500,000
- Above 500,000
Record the formula, post count, dates, follower band, campaign type, and whether posts were paid or organic. Engagement rates can fall when audience growth outpaces interaction growth. Report total engagements, reach, qualified clicks, leads, and pipeline alongside the percentage.
Use these baselines to set funnel-stage targets for monthly reporting.
Funnel Metrics, Targets, and Monthly Reporting
Choose Metrics by Funnel Stage
Track audience response, qualified demand, and commercial results separately. Likes show reactions, not reach or purchase intent. Define the conversion event you want to measure: a qualified form submission, booked demo, trial activation, purchase, or closed-won opportunity.
| Funnel stage | Objective | Primary social metrics | Secondary business metrics | Benchmark type |
|---|---|---|---|---|
| Awareness | Reach relevant people and build visibility | Reach, impressions, video views, view-through rate, follower growth, non-follower reach, share of voice | Branded search lift, frequency, sentiment | External platform or industry benchmarks for context; first-party trend targets for decisions |
| Consideration | Generate meaningful interest and research behavior | Comments, saves, shares, profile visits, outbound clicks, CTR, direct messages | Social referral sessions, engaged sessions, downloads, landing-page engagement, qualified traffic | Format- and audience-matched engagement and traffic benchmarks |
| Conversion | Create qualified demand and commercial outcomes | Lead-conversion rate, demo or trial conversions, purchase conversions | Cost per lead, cost per acquisition, qualified pipeline, revenue, paid ROAS | First-party historical performance and finance or sales targets |
| Loyalty and advocacy | Retain customers and encourage recommendations | Repeat engagement, mentions, reviews, user-generated content, community activity | Repeat purchases, referrals, retention, customer satisfaction, support resolution and deflection | Customer cohort and business-outcome benchmarks |
Set monthly targets for each stage, covering both engagement and downstream demand.
Keep formulas consistent. Engagement rate by reach = engagements ÷ reach; CTR = outbound clicks ÷ impressions or reach. Lead-conversion rate = leads ÷ attributable sessions or clicks; CPL = ad spend ÷ leads; CPA = ad spend ÷ conversions; ROAS = attributed revenue ÷ ad spend.
Keep the monthly reporting window separate from the conversion lookback window. Label click-through and view-through credit separately.
Set Baseline, Strong, and Top Performance Targets
Use the trailing 3- to 6-month median as your baseline, matching the account, platform, audience band, distribution type, and format.
Strong performance means improvement without reducing qualified traffic, lead acceptance, conversion rate, or downstream value. Top performance means beating that baseline across comparable posts for a full test window - not producing 1 viral post. Define the window before launch, allow for conversion lag, and flag small samples. No single percentage uplift makes a result strong.
| Metric | Baseline source | Target level | Review interval | Decision rule |
|---|---|---|---|---|
| Reach-based engagement rate | Median of comparable organic posts over 6 months | Baseline, strong, and top bands based on the team’s own distribution | Monthly, with post-level review after posts have had enough time to perform | Retain or expand formats that improve engagement without reducing qualified traffic |
| Outbound CTR | Median for the same platform, audience, and link-post format | Improve against the matched baseline while maintaining landing-page quality | Weekly or monthly, depending on volume | Check hooks, targeting, and landing-page alignment when CTR falls |
| Qualified lead-conversion rate | Historical social referral conversion rate | Meet or exceed the sales-accepted lead standard | Monthly or by campaign | Do not scale traffic if lead quality or acceptance declines |
| Cost per lead or acquisition | Prior paid-social campaigns with comparable objectives | Stay within the approved efficiency range | Weekly for pacing; monthly for quality | Reallocate spend only after checking conversion lag and sample size |
| Attributed pipeline or revenue | CRM records using the documented attribution model | Meet the campaign or revenue plan | Monthly and quarterly | Compare sourced and influenced outcomes before budget decisions |
Put these targets in 1 monthly scorecard so you can compare trends by platform, format, and funnel stage.
Build a Monthly Scorecard and Check the Data
Use 1 row per platform-account-format-period combination, split by funnel stage, distribution type, and content theme.
Small businesses using free sales funnel tools can reconcile leads and sales manually. Mid-market teams should connect campaign UTMs to analytics and CRM stages. Portfolio revenue leaders need shared definitions across companies while keeping account-level drill-downs. Include these fields:
| Scorecard field | What to record |
|---|---|
| Platform and account | Network, handle or account, market, and business unit |
| Audience band | Follower or reachable-audience range and relevant target segment |
| Format and theme | Video, image, carousel, Story, live content, link post, and content theme |
| Funnel stage | Awareness, consideration, conversion, or loyalty and advocacy |
| Distribution type | Organic, boosted, or paid; record campaign and ad-set identifiers where applicable |
| Visibility | Reach, impressions, frequency, views, and view-through rate |
| Engagement | Total engagements, engagement rate, denominator, saves, shares, comments, and profile visits |
| Traffic | Outbound clicks, CTR and denominator, referral sessions, landing-page views, and downloads |
| Commercial results | Leads, qualified leads, demos, trials, purchases, paid costs, attributed revenue, CPL, CPA, and ROAS |
| Comparison | Trailing median, delta, and sample-size note |
| Source and method note | Platform export, analytics system, CRM, benchmark publication, attribution model, and lookback window |
Before comparing results, check the cohort, platform, geography, time zone, formulas, denominators, distribution type, format, content theme, and post age. Note any changes to the platform, algorithm, targeting, budget, or tracking. Use medians or trimmed means when outliers skew averages.
Reconcile platform clicks, analytics sessions, and CRM conversions. Check UTMs, tracking gaps, duplicate conversions, and offline imports. Flag small samples instead of declaring a winner.
Keep sourced and influenced results separate when social contributes at multiple stages. Attribution assigns credit, not causality. Sourced pipeline credits social as the originating source under your agreed rules. Influenced pipeline records a social touch somewhere in the journey. Do not add overlapping totals.
Instagram Engagement Is Changing in 2026: Benchmarks Explained by Social Media Strategists
Conclusion: Tie Engagement to Business Outcomes
Use benchmark tables as context, not verdicts. Compare results only when the platform, format, audience band, date range, and paid/organic mix match. Industry averages provide context; your account’s baseline should guide decisions.
Then assess results by their role in the funnel. Reach and impressions measure awareness. Clicks, saves, shares, and comments measure consideration. Conversions and opportunities measure business impact. Higher engagement is a loss if it lowers traffic quality.
In monthly reporting, use the scorecard to test one variable at a time - hook, format, or call to action - against the account baseline. Allow time for conversions, and record both the change and its downstream result. Keep only changes that improve qualified traffic, conversion rate, opportunities, and pipeline.
FAQs
How do I benchmark a new social account?
Audit engagement rates, reach, and conversions to set a baseline. Compare your results with industry standards: engagement rates typically range from 1% to 5%. Since benchmarks differ by industry, platform, and company size, give your own historical data the most weight.
Track progress with platform-specific tools. The Marketing Funnels Directory can help you find tools that connect social metrics with funnel and pipeline reporting.
How many posts make a reliable benchmark?
There’s no fixed post count. Use a sample large enough to keep random chance from skewing results. Run tests until they reach statistical significance. In B2B funnels, reaching a 95% confidence level typically takes 4 to 6 weeks.
If you have limited internal history, use a rolling median or a historical distribution from comparable campaigns. Match the channel, audience, and offer to keep comparisons accurate.
Why is engagement rising while qualified leads fall?
More likes, comments, and shares can increase social engagement, even as the funnel loses prospects after they click. Common causes include mismatched ads, landing pages, and calls to action; landing-page friction; or traffic from people who aren't a good fit. That traffic can add leads without improving the qualified-lead rate.
Track click-to-form conversion, form completion, and qualified-lead yield by funnel stage and channel to see where performance drops.