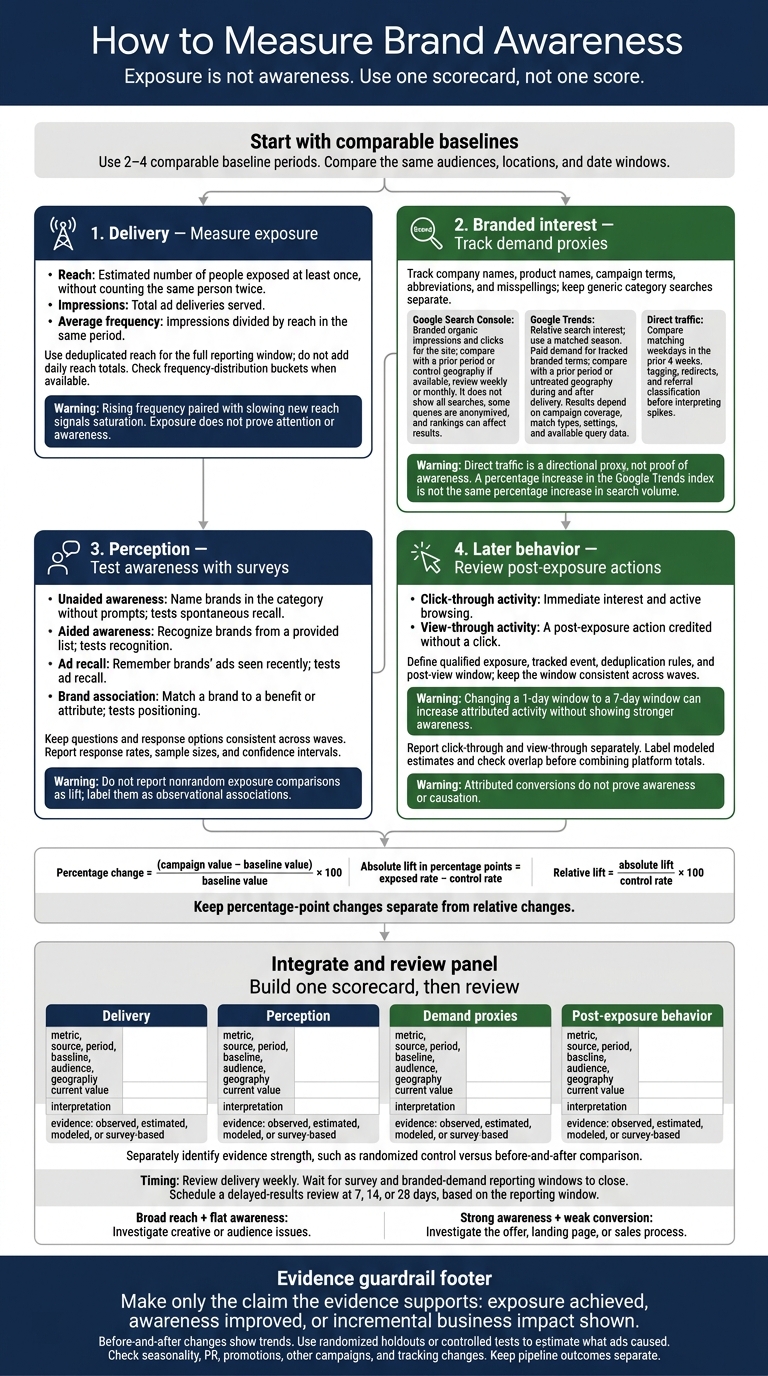
I measure brand awareness by checking whether ad exposure changes recognition, recall, or branded interest - not just clicks. I start with 2-4 comparable baseline periods, then compare the same audiences, locations, and date windows.
My measurement plan uses marketing funnel software to cover 4 areas:
- Delivery: Reach, impressions, and frequency.
- Perception: Surveys that test awareness, ad recall, and brand associations.
- Branded interest: Search activity and direct traffic.
- Later behavior: Tracked actions after an ad view, reported separately from clicks.
I put these signals in one scorecard and review delivery weekly. I wait for survey and search reporting windows to close before judging results. Before-and-after changes show trends; I use randomized holdouts or controlled tests to estimate what the ads caused.
<u>Exposure alone does not prove awareness.</u> I keep each claim tied to what the data supports.
How to Measure Brand Awareness
Measure Ad Exposure and Branded Interest
Step 3: Measure Reach, Impressions, and Frequency
Measure reach, impressions, and frequency before looking for awareness lift. Report all three for the same audience, geography, and period so you can separate ad delivery from actual awareness. Consult a directory for marketing funnels to find tools that automate this tracking. Then check whether exposure increased branded interest.
| Metric | Definition | Awareness-stage purpose | Main limitation |
|---|---|---|---|
| Reach | Estimated number of people exposed at least once, without counting the same person twice | Measures breadth of delivery | Exposure does not prove attention |
| Impressions | Total ad deliveries served | Measures delivery volume | Repeat deliveries do not mean more people |
| Average frequency | Impressions divided by reach in the same period | Measures average repetition | An average can hide uneven exposure |
Break down all three metrics by audience, creative, placement, geography, and period.
Use deduplicated reach for the full reporting window, rather than adding daily reach totals. Frequency helps show whether exposure is spread across the audience or concentrated among fewer people. Check frequency-distribution buckets when available. Rising frequency paired with slowing new reach signals saturation, not an ideal frequency.
When delivery increases, test whether brand demand moves with it.
Step 4: Monitor Branded Search and Direct Traffic
Track a fixed set of branded queries: company names, product names, campaign terms, abbreviations, and misspellings. Keep generic category searches separate.
When awareness grows, branded search should usually move before conversions do.
| Source | Baseline | Timing | Interpretation | Attribution limits |
|---|---|---|---|---|
| Google Search Console | Prior period; control geography if available | Weekly or monthly | Branded organic impressions and clicks for the site | Does not show all searches; some queries are anonymized, and rankings can affect results |
| Google Trends | Matched season or control geography | Campaign and post-campaign | Relative search interest, normalized to a baseline | Does not show absolute search volume |
| Branded paid-search reports | Prior period or untreated geography | During and after delivery | Paid demand recorded for tracked branded terms | Depends on campaign coverage, match types, settings, and available query data |
Compare search gains with direct site visits.
For count metrics with a nonzero baseline, calculate percentage change = (campaign value − baseline value) ÷ baseline value × 100. Use the same metric definition and comparison window throughout. A percentage increase in the Google Trends index does not equal the same percentage increase in search volume.
Direct traffic can signal recall, but it is noisier than search data. Review direct sessions by landing page, new-user share, geography, and time. Compare the campaign window with matching weekdays in the prior 4 weeks. Before interpreting a spike, check for changes in tagging, redirects, and referral classification. Treat direct traffic as a directional proxy, not proof of awareness, and assess it alongside the search signals.
sbb-itb-a84ebc4
Assess Brand Perception and Post-Exposure Behavior
Step 5: Measure Awareness with Brand-Lift Surveys
Surveys measure recognition, recall, and associations. Later actions show behavior. Match each question to what you want to measure: recall, recognition, memorability, or positioning. Keep wording and response options consistent across campaign waves.
| Measure | Question approach | Purpose | Main limitation |
|---|---|---|---|
| Unaided awareness | Ask respondents to name brands in the category without prompts | Tests spontaneous recall | Depends on category familiarity, wording, and sample size |
| Aided awareness | Show brand names and ask which ones respondents recognize | Tests recognition | Recognition can overstate meaningful awareness |
| Ad recall | Ask which brands’ ads respondents remember seeing recently | Tests ad recall | Respondents may confuse campaigns or remember earlier ads |
| Brand association | Ask which brand best matches a benefit or attribute | Tests whether people are learning the positioning | Stronger associations do not necessarily mean broader awareness |
Before launch, check survey eligibility by platform, country, audience size, and minimum sample requirements. Do not report nonrandom exposure comparisons as lift. Label them as observational associations, and check whether other campaigns exposed the control group.
Report response rates, sample sizes, and confidence intervals. Calculate lift as follows:
- Absolute lift in percentage points = exposed rate − control rate.
- Relative lift = absolute lift ÷ control rate × 100, when the control rate is nonzero.
Record the questions, response options, field dates, target audience, exposed and control response rates, and campaign wave. Check for nonresponse bias and differences in audience mix by age, geography, device, and customer status. Compare results across waves.
Then check whether exposed audiences took later actions.
Step 6: Review View-Through Activity
View-through data shows whether exposure was followed by tracked behavior, even without a click.
View-through activity is a post-exposure action credited without a click. Define the qualified exposure, tracked event, deduplication rules, and post-view window using the platform’s reporting rules. Keep that window consistent across waves. Moving from a 1-day to a 7-day window can increase attributed activity without showing stronger awareness.
Report click-through and view-through results separately. Use supported breakdowns by placement, audience, device, geography, and conversion type. Results depend on identity matching, attribution windows, modeled estimates, and platform rules.
| Signal | Awareness-stage role |
|---|---|
| Click-through activity | Shows immediate interest and active browsing. |
| View-through activity | Shows tracked actions after exposure without a click. |
| Branded search | Shows active branded interest after delivery. |
| Direct traffic | May reflect recall or offline discovery. |
Measure visits in first-party analytics and use holdouts to estimate incrementality. Browsers that block cross-site cookies prevent some view-through conversions from being reported. Cross-device gaps can also leave activity unlinked.
Label modeled estimates and check for overlap before combining platform totals. Assess post-exposure trends alongside survey lift and delivery data, without treating an attributed conversion as proof of awareness or causation.
Build a Brand Awareness Dashboard
Step 7: Create an Awareness Scorecard
Put the core signals in one view. Use one scorecard, not one score. Group metrics by delivery, perception, demand, and post-exposure behavior.
| Dashboard layer | Measures to include | Dashboard role |
|---|---|---|
| Delivery | Reach, impressions, average frequency, video completion rate, cost | Exposure overview |
| Perception | Aided awareness, unaided awareness, ad recall, brand association, consideration | Awareness and perception |
| Demand proxies | Branded-search activity, direct traffic, branded website sessions | Branded-interest trends |
| Post-exposure behavior | View-through visits, engaged sessions, content consumption | Follow-on activity |
For each row, record the metric, source, period, baseline, audience, geography, current value, change, and interpretation. Label the evidence as observed, estimated, modeled, or survey-based. Separately note its strength, such as whether it comes from a randomized control or a before-and-after comparison. Keep percentage-point changes separate from relative changes. Use consistent U.S. formatting for counts, decimals, and costs, if included.
Keep the executive view short, with drill-downs by audience, geography, device, platform, creative, placement, and exposure level. At a minimum, compare target and non-target audiences, new and existing audiences, major U.S. regions or states, and key customer segments.
Flag small samples. Record outside factors that could affect results: promotions, news coverage, holidays, product launches, competitor activity, economic conditions, and tracking changes. Keep pipeline outcomes in a separate panel, labeled as influenced, attributed, or incrementally measured.
Use the scorecard to set review timing and decide when measurement tools need adjustments.
Step 8: Review Results and Choose Measurement Tools
Once the dashboard is live, review delivery weekly. Wait until survey and branded-demand windows close before judging lift. Schedule a delayed-results review at 7, 14, or 28 days, based on the reporting window.
Check whether broad exposure leads to stronger perception or demand. Investigate mismatches before changing spend. Flat awareness despite broad reach points to creative or audience issues. Strong awareness with weak conversion points to the offer, landing page, or sales process.
Choose tools based on integrations, survey access, consistent attribution windows, audience reporting, exportability, and experiment support - not widget count.
Connect ad-platform delivery, analytics, search data, surveys, and CRM reporting, but don't treat their totals as interchangeable. Preserve raw exports and measurement settings.
Measuring brand awareness: Search, surveys & more | Elea McDonnell Feit | Coffee Breaks
Conclusion: Assess Awareness Across Multiple Signals
Exposure is not awareness. Delivery metrics show exposure. Branded search, direct traffic, surveys, and view-through trends help test whether that exposure changed interest or recall.
Compare the same audiences, geographies, and date windows. Growth in branded demand can point to greater interest, but seasonality, PR, promotions, and other activity may also explain it.
Treat view-through activity as a directional signal, not proof of cause and effect. Before making major budget or pipeline decisions, use a randomized holdout or matched-region test.
Brand-lift surveys compare exposed and control groups. Make only the claim the evidence supports: exposure achieved, awareness improved, or incremental business impact shown.
Awareness may grow before qualified pipeline appears, especially when sales cycles are long.
FAQs
How can I measure awareness on a small budget?
Track low-cost metrics like reach, impressions, and engagement rates to measure visibility and audience interest. Check website traffic sources to see which channels bring in organic or referral visits. Monitor branded search volume for signs that more people recognize your brand.
Use free or low-cost tools like Google Analytics 4, Meta Business Suite, and Google Search Console to collect this data.
What counts as meaningful brand awareness lift?
Brand awareness lift means your target audience is more likely to recognize and remember your brand. Look for steady growth in branded search volume (searches for your brand name), direct traffic (intentional site visits), reach, impressions, and share of voice.
Survey results or organic traffic increases that line up with your awareness campaigns can help confirm that lift.
How do I measure awareness across paid social platforms?
Track reach and unique reach (people who saw your ads), frequency (how often they saw them), impressions (total ad appearances), and engagement rate (likes, comments, shares, and saves).
To measure awareness beyond the ad itself, monitor view-through rate and branded search lift or volume. Check direct traffic or branded mentions to validate those results. Connect the data with GA4, UTM parameters (utm_source for the platform and utm_medium=paid-social), and platform analytics tools such as Meta Business Suite.