CTA conversion rates show how many users take action after interacting with your call-to-action (CTA), like clicking a button or filling out a form. Here's what you need to know:
- Formula: (Conversions ÷ Total Visitors) × 100. Example: 75 signups from 1,000 visitors = 7.5% conversion rate.
- Healthy Range: 2%-5% is typical, but this depends on your industry and audience.
- Optimization Tips:
- Personalized CTAs: Perform 202% better.
- Single CTA in Emails: Boosts clicks by 371% and sales by 1,617%.
- Above-the-Fold Placement: Increases performance by 304%.
- Mobile Optimization: Improves conversions by 32.5%.
Key Metrics to Track:
- Click-Through Rate (CTR): Measures how many users click the CTA.
- Bounce Rate: Tracks users leaving after clicking.
- Device Performance: Shows how different devices impact conversions.
Tools to Use:
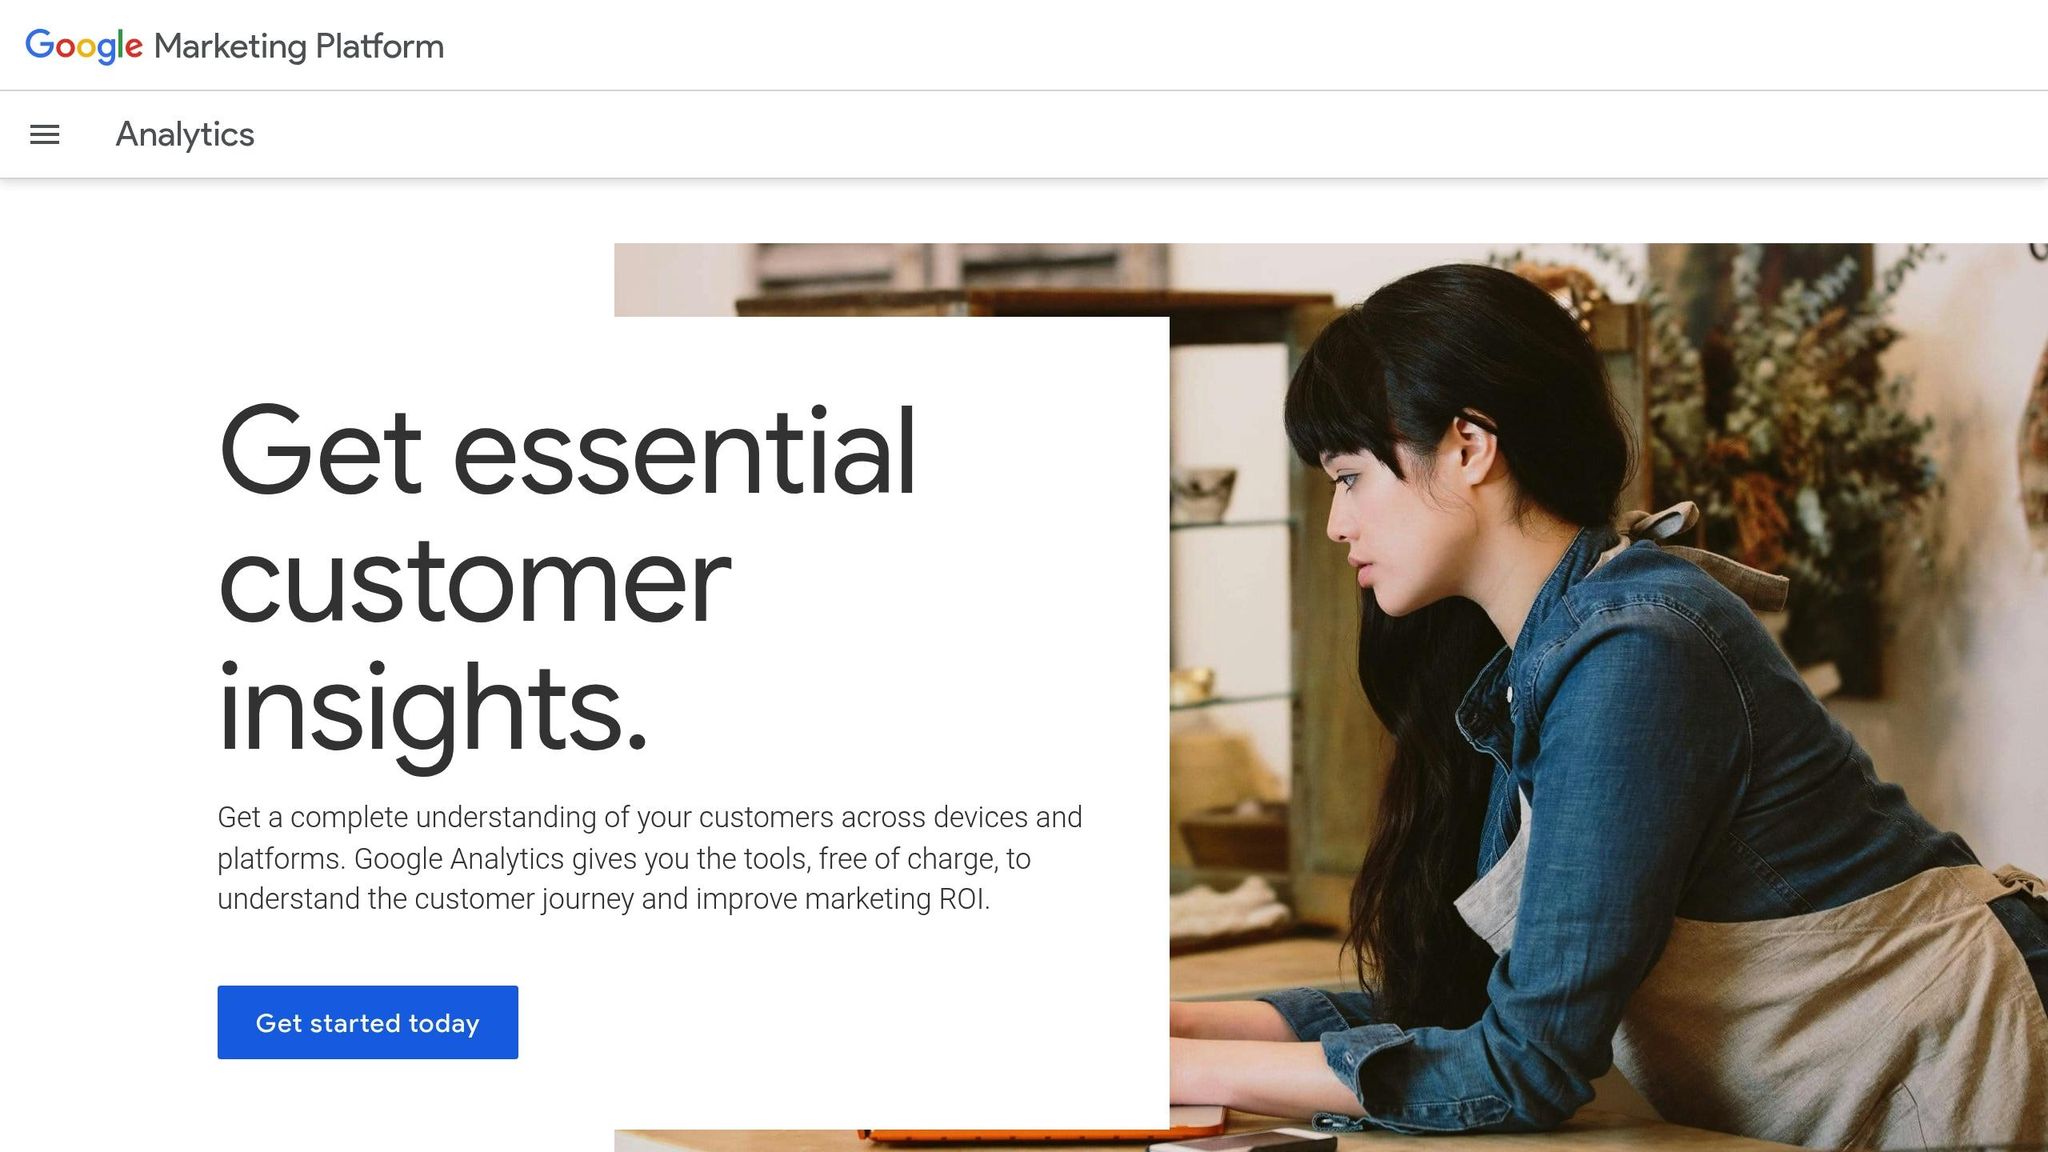
- Google Analytics: Tracks CTA events and user actions.
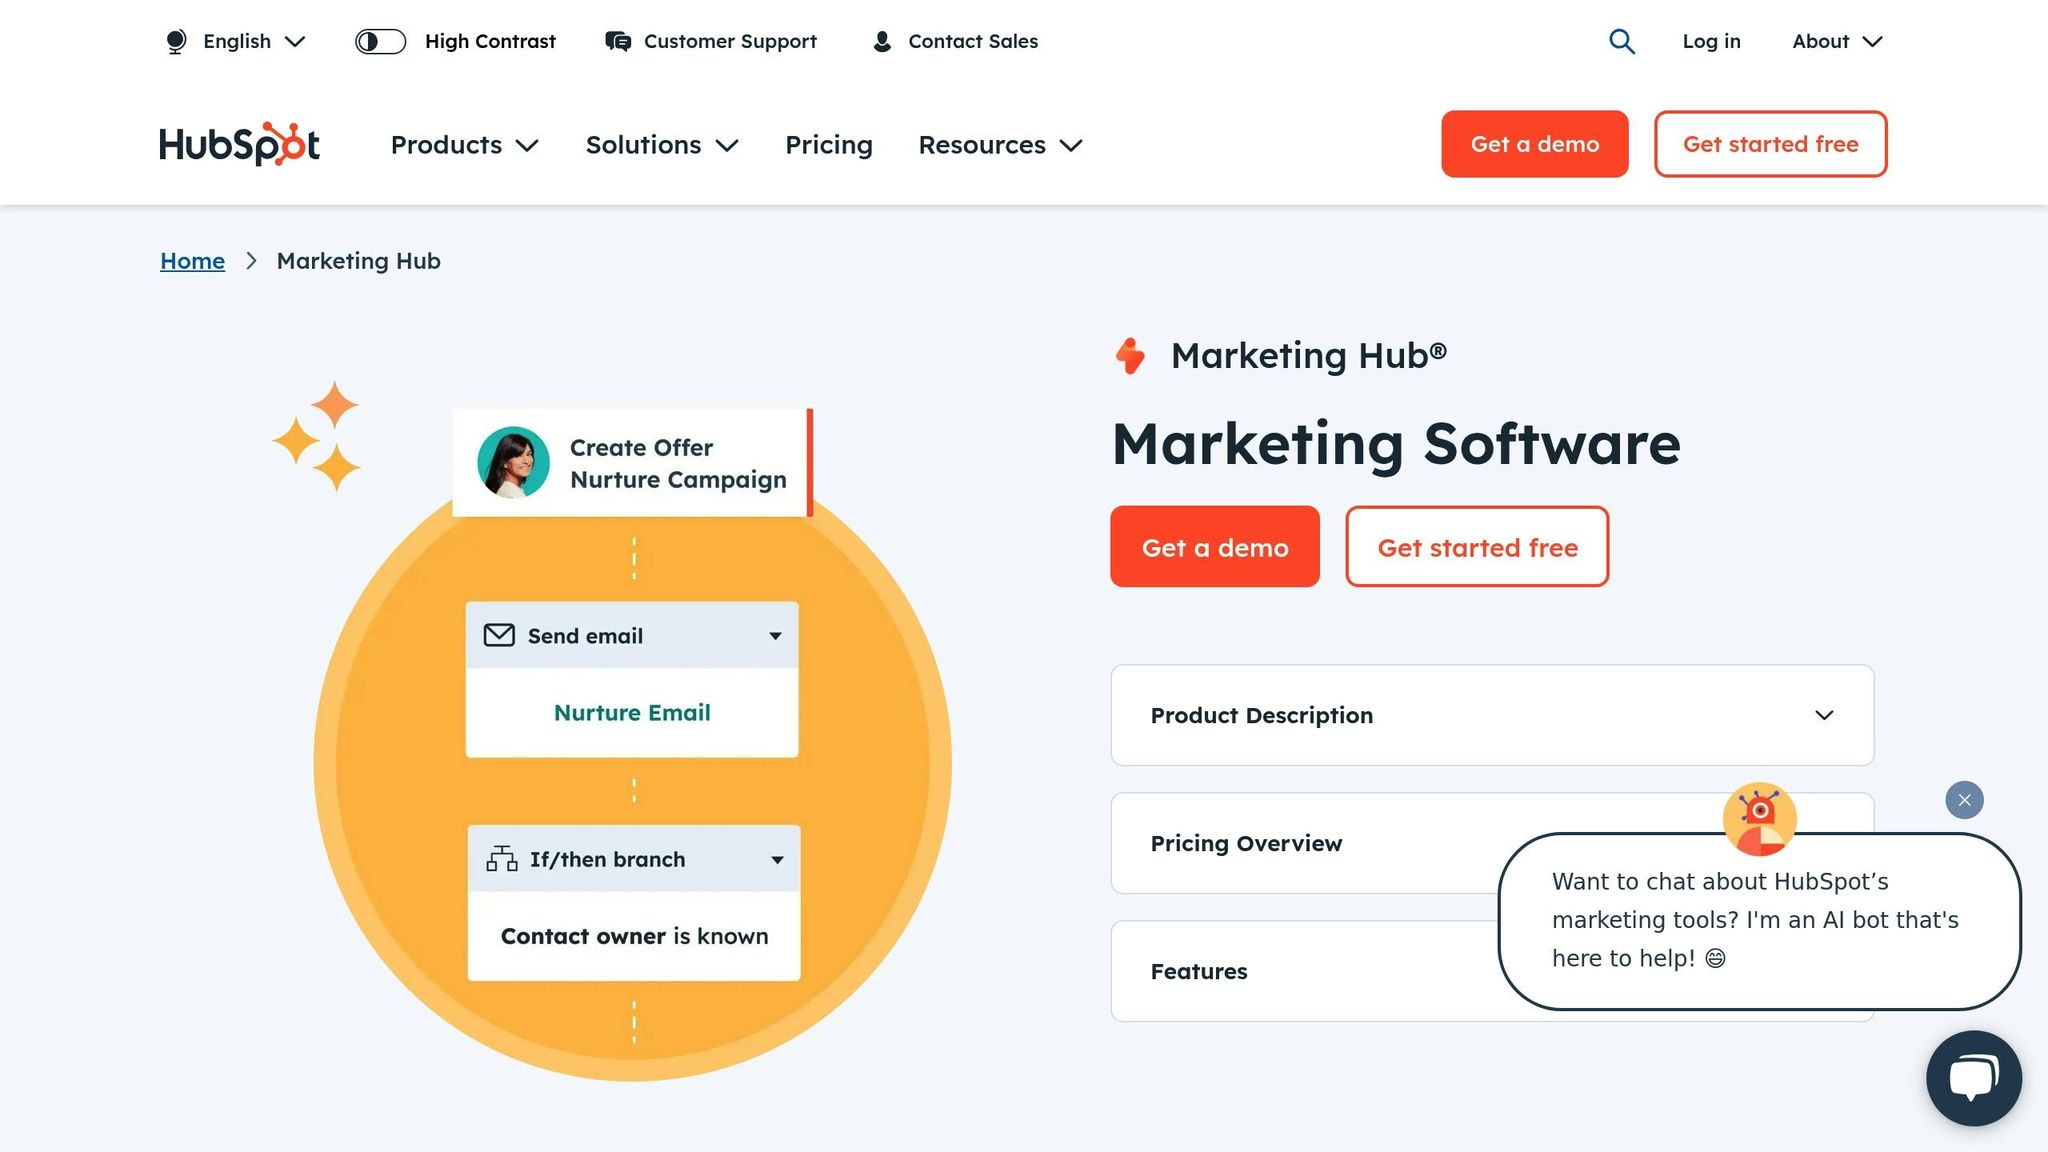
- HubSpot: Offers detailed CTA performance dashboards.
- Behavior Tools: Use Hotjar or Crazy Egg for heatmaps and session recordings.
Pro Tip: Even small changes, like tweaking button text, can increase conversions by 17.5%. Start tracking and testing today to improve your results.
How to Calculate CTA Conversion Rates
Basic Conversion Rate Formula
To calculate your CTA conversion rate, use this formula:
(Number of Conversions ÷ Total Visitors) × 100 = Conversion Rate %
For example, if your landing page's call-to-action (CTA) brings in 75 newsletter signups from 1,000 visitors, the calculation would look like this:
(75 ÷ 1,000) × 100 = 7.5%.
Typically, a conversion rate between 2% and 5% is considered a healthy benchmark for most digital marketing campaigns. However, keep in mind that results can vary based on factors like your industry, target audience, and campaign specifics.
This formula is a fundamental tool for assessing the effectiveness of CTAs across different campaigns.
Real-World Calculation Examples
Here are two practical scenarios that demonstrate how to apply this formula:
-
E-commerce Product Sales
A retail shop selling posters monitored their sales over a 30-day period:- Total site visitors: 12,355
- Poster purchases: 181
- Conversion Rate = (181 ÷ 12,355) × 100 = 1.46%.
-
Custom Product Orders
An online retailer specializing in personalized socks reviewed their performance for May 2025:- Monthly unique visitors: 55,000
- Personalized sock orders: 800
- Conversion Rate = (800 ÷ 55,000) × 100 = 1.45%.
Key Performance Metrics
While conversion rates are essential, they don’t tell the whole story. Tracking additional metrics can uncover insights into user behavior and where improvements are needed:
| Metric | Description | Why It Matters |
|---|---|---|
| Click-Through Rate (CTR) | Percentage of users who click the CTA | Measures how well your CTA grabs attention. |
| Bounce Rate | Percentage of users who leave after clicking | Highlights potential friction or issues. |
| Time on Page | Average time users spend before converting | Shows how engaging and relevant your content is. |
| Device Performance | Conversion rates segmented by device type | Identifies opportunities for optimization by device. |
For more targeted tracking, you can use specialized formulas tailored to specific goals:
- Lead Conversion Rate = (Leads ÷ Visitors) × 100
- Email Signup Rate = (Subscribers ÷ Visitors) × 100
- Cart Completion Rate = (Purchases ÷ Cart Starters) × 100
- Landing Page Conversion Rate = (Form Fills ÷ Page Visits) × 100
Tools like Google Analytics Goals can simplify tracking these metrics, helping you identify trends and areas for improvement.
CTA Tracking Tools
Google Analytics Setup Guide

To track CTA interactions effectively with Google Analytics, follow these steps:
- Event Tracking Configuration
Insert the following tracking code into your CTA button to track user actions:
onclick="_gaq.push(['_trackEvent', 'RequestADemo', 'FrontPage', 'Middle']);"
This code helps organize your tracking data into a structured hierarchy, making it easier to analyze user behavior.
- Goal Configuration
Define your goals based on these criteria:
| Goal Type | Best Used For | Setup Priority |
|---|---|---|
| Destination | Thank you pages, confirmation screens | High |
| Event | Button clicks, form submissions | High |
| Duration | Time-based engagement | Medium |
| Pages/Visit | Content consumption | Medium |
Once you've set up these goals, you can dive into HubSpot's dashboard for additional insights into your CTA performance.
HubSpot CTA Dashboard

HubSpot provides a detailed dashboard to track key CTA metrics, such as:
- Click-through tracking: Measures the percentage of visitors clicking your CTAs.
- Form completion analysis: Tracks how many users complete forms after clicking.
- Page-level insights: Identifies which pages drive the most CTA engagement.
- Visitor segmentation: Breaks down performance by user type and traffic source.
The platform also reports impressions, clicks, and conversion rates automatically, offering valuable guidance on where to place CTAs and how to optimize their design.
For a deeper understanding of user behavior, consider leveraging additional behavior analysis tools.
User Behavior Analysis Tools
Here’s a comparison of some popular tools for analyzing user interactions:
| Tool | Key Features | Price (Annual) | Rating |
|---|---|---|---|
| Hotjar | Heatmaps, session recordings | $32/mo (Plus) | 4.3/5 |
| Crazy Egg | A/B testing, scroll maps | $99/mo (Plus) | 4.2/5 |
| Microsoft Clarity | Heatmaps, session replay | Free | N/A |
| Mouseflow | Form analytics, funnels | $31/mo (Starter) | 4.5/5 |
"The surveys, session recordings & heatmaps features appeal to us the most. Knowledge and customer data are king, and these two features shape our roadmap as to what we prioritize for development and initiatives we work on. At the moment, we are using surveys as the primary source of behavioral insight. This then shapes what the priorities are for features for our customers."
– Alice Michael, Group Head Of Ecommerce Operations, APG & Co
Businesses that incorporate behavior tracking tools report up to a 115% increase in ROI compared to those that don't use these solutions.
Bringing It All Together
For comprehensive CTA tracking, combine these approaches:
- Use Google Analytics to gather quantitative data and set up clear goals.
- Leverage HubSpot's dashboard for detailed conversion metrics.
- Incorporate behavior analysis tools to uncover patterns in user interactions.
- Set up event tracking to capture specific user actions seamlessly.
This multi-tool strategy ensures you gain a complete picture of how users interact with your CTAs, helping you refine and improve your campaigns.
How to Improve CTA Performance
Finding Performance Issues
To boost your call-to-action (CTA) effectiveness, start by examining these core metrics:
| Issue Area | Key Metrics | Improvement Target |
|---|---|---|
| Visibility | Scroll depth, time on page | Place CTAs above the fold for 57% more views |
| Engagement | Click-through rate, bounce rate | Ensure pages load in under 3 seconds to avoid a 32% bounce increase |
| Conversion | Form completions, sales | Personalization can lead to a 202% improvement in conversions |
Use tools like heatmaps and session recordings to identify where users drop off. Pay special attention to mobile load times, as delays exceeding three seconds can significantly increase bounce rates.
CTA Split Testing Guide
A/B testing is a powerful way to refine your CTAs. Here are some proven approaches that have delivered results for leading companies:
-
Button Text Testing
DocuSign saw a 35% boost in mobile conversion rates by simplifying their sign-up process. Test elements like:- Action-oriented words (e.g., "Start", "Get", "Try")
- Value-driven statements (e.g., "Save Money Today", "Begin Your Journey")
- Urgency cues (e.g., "Limited Time", "Act Now")
-
Visual Elements
True Botanicals reported a $2M+ estimated ROI increase by optimizing product pages with:- High-contrast colors to make CTAs stand out
- Strategic button placement
- Adding social proof near CTAs
-
Placement Strategy
Strategic positioning of CTAs can significantly affect conversions:- Right-side placement can lead to 47% higher conversion rates
- Positioning near product images increases conversions by 29%
- CTAs at the end of blog posts see a 22% higher click likelihood
Use these insights to refine your approach and adapt CTAs for different devices.
Device-Specific Optimization
Given that over 60% of web traffic comes from mobile devices, optimizing CTAs for mobile is essential. However, desktop traffic still generates twice the conversion rates. Adjust your approach for each platform to maximize results.
Mobile Optimization Tips:
- Design large, easy-to-tap buttons
- Provide one-click options for convenience
- Include guest checkout to reduce barriers
- Ensure pages load in under 4 seconds to meet user expectations
Desktop Enhancement Strategies:
- Keep layouts clean and uncluttered
- Position CTAs prominently
- Maintain consistent branding throughout
- Use interactive hover effects to increase engagement
Real-World Example: Alaska Airlines boosted mileage plan sign-ups by 18% after tailoring CTAs for different devices. They also reduced implementation time from three months to just four weeks.
sbb-itb-a84ebc4
Linking CTAs to Marketing Funnel Success
CTAs at Each Funnel Stage
To get the most out of your CTAs, it's essential to align them with the specific stages of your marketing funnel. A well-targeted approach ensures your messaging resonates with potential customers, ultimately driving better results.
| Funnel Stage | CTA Type | Key Metrics |
|---|---|---|
| Awareness (TOFU) | Newsletter signup, Free guide download | Click-through rate, Email captures |
| Consideration (MOFU) | Free trial, Product demo | Demo requests, Trial activations |
| Decision (BOFU) | Purchase, Consultation booking | Sales conversions, Booking completions |
Take Netflix, for example. Their "Join Free for a Month" CTA is a masterclass in combining value with urgency, which helps them achieve higher engagement rates. Up next, let's explore how analyzing funnel data can fine-tune your CTA strategy.
Using Data to Adjust Funnels
Refining your CTAs starts with understanding how users interact with them. Here are some strategies to guide your adjustments:
-
Drop-off Analysis
Identify where users are leaving your funnel. For instance, about 70% of online shoppers abandon their carts due to overly complex forms or lengthy checkout processes. Simplifying these steps can help keep users moving forward. -
Engagement Patterns
Look at how people engage with CTAs at different stages. Slack’s "Get Started for Free" is a great example - it removes the pressure of commitment, which has been shown to boost conversions. -
Device Performance
Pay attention to how conversions vary across devices. If mobile users aren’t converting as well as desktop users, it might be time to revisit your mobile optimization efforts.
These insights are invaluable for optimizing your funnel, setting the stage for the tools and resources covered in the next section.
Tools and Learning Materials
If you're serious about improving your CTA strategy, the Marketing Funnels Directory is packed with helpful resources:
- Conversion Analysis Tools: Discover software designed to track and analyze CTA performance across all funnel stages.
- Educational Resources: Dive into courses that teach the ins and outs of sales funnel strategies and CTA optimization.
- Industry Benchmarks: Compare your metrics to see how you stack up against others in your field.
"Creating an effective call to action goes beyond design and copy. It has everything to do with aligning your offer and CTA with your sales funnel to ensure it's relevant to the audience's intent." - Andrew Raso, co-founder and director of Online Marketing Gurus
One last tip: Gamified CTAs can generate up to nine times more click-throughs than standard ones. By crafting engaging, interactive experiences tailored to each funnel stage, you’ll not only capture attention but also improve overall conversions. Just don’t forget to measure your success at every step!
How to Create Effective CTAs for Better Conversions #shorts #CRO #conversionrateoptimization #b2b
Summary
Tracking CTA conversion rates requires a structured approach and the right tools. Even minor tweaks, like changing a single word on a CTA button, can lead to a 17.5% increase in conversions.
Here’s how different industries stack up when it comes to average conversion rates:
| Industry | Average Conversion Rate |
|---|---|
| Finance | 5.01% |
| B2B | 2.23% |
| Legal | 2.07% |
| eCommerce | 1.84% |
These benchmarks serve as useful targets for assessing and improving your own performance. For example, OUI.sncf managed to boost conversions by 61% simply by running A/B tests on their ticket information page.
To make your CTAs more effective, focus on these key strategies:
- Personalized messaging: Tailor your CTAs to resonate with your audience.
- Creating urgency: This tactic has been shown to drive a 332% increase in conversions.
- Optimizing button placement: Buttons placed above the fold can perform 304% better.
- Simplifying design: Using a single CTA can boost sales by an astonishing 1,617%.
"From my experience, measuring the impact of CTA design on conversion rates is all about testing and tracking."
- Daniel Rosca, Conversion Optimization Manager, Paddy Power Betfair
Use these insights to refine your CTAs, experiment with different variables, and fine-tune their placement. For more tools and strategies, check out the Marketing Funnels Directory to take your funnel optimization to the next level.
FAQs
How can I tell if my CTA conversion rate is good for my industry?
To determine if your CTA (Call to Action) conversion rate is hitting the mark, it's helpful to compare it with industry standards. Conversion rates can differ significantly depending on the sector, typically falling between 3.8% and 12.3%, with standout performers reaching rates above 11.5%. On average, across various platforms, the conversion rate for CTAs sits around 2.4%.
If your numbers are in line with or above these averages, you're likely doing well. If not, it might be time to tweak your CTAs, refine your targeting, or revisit your marketing funnel to better engage your audience and guide them effectively through their journey.
What common mistakes can hurt my CTA conversion rates?
When it comes to Call to Action (CTA) conversion rates, a few common missteps can really hurt your results. One major issue is poor design or placement. If your CTA is hard to spot or blends into the background, visitors might not even notice it’s there. Another big problem? A complicated or drawn-out process. Think about forms that ask for too much information or instructions that leave people scratching their heads - these can frustrate users and make them give up entirely.
On top of that, slow-loading pages and low-quality visuals can ruin the user experience, making it less likely that someone will engage with your CTA. To boost conversions, focus on making your CTAs stand out visually, place them where they’re easy to find, and ensure the process that follows is smooth and hassle-free.
How can I use A/B testing to improve my CTA conversion rates?
To boost your CTA conversion rates using A/B testing, start by defining a specific goal and hypothesis. For instance, you might test whether updating the CTA text from "Sign Up" to "Start Your Free Trial" results in more clicks. Develop two versions of your CTA: the original (control) and a revised version (variant). Focus on testing just one element at a time - such as the text, color, or placement - so you can pinpoint what drives the change.
Leverage an A/B testing tool to randomly present each version to your audience and track their interactions. Ensure the test runs long enough to collect enough data for meaningful analysis. Once the results are in, evaluate metrics like click-through rates or conversion rates to identify the better-performing version. Use these findings to fine-tune your CTAs, tailoring them to your audience’s preferences and improving your overall funnel efficiency.


