Running A/B tests without aligning metrics to your funnel goals is like driving with a broken GPS - you’re moving but not in the right direction. Misaligned metrics lead to wasted efforts, missed opportunities, and lost revenue. Aligning metrics with funnel goals, however, helps you focus on what truly matters, improving both your strategy and results.
Here’s the key takeaway: Each funnel stage - Awareness, Consideration, Conversion - requires specific metrics to measure success. For example:
- Awareness Stage: Track traffic, impressions, and bounce rate to measure reach and engagement.
- Consideration Stage: Focus on lead quality and engagement to gauge how well you’re nurturing prospects.
- Conversion Stage: Use conversion rates, CAC, and ROAS to evaluate sales efficiency and profitability.
By choosing metrics that match each stage’s goals, you can pinpoint weak spots, improve performance, and drive growth. Always ensure your metrics are relevant, actionable, measurable, and aligned with user behavior at each stage. Combine data with user feedback to refine your strategy further.
A/B testing becomes more effective when tied to funnel-specific metrics, helping you identify what works and where to optimize. For example, tweaking a landing page headline in the Awareness stage or simplifying checkout in the Conversion stage can yield measurable improvements. Start by analyzing where users drop off, set clear benchmarks, and test changes tailored to that stage.
The bottom line? Aligning metrics with funnel goals ensures every effort contributes to moving prospects closer to becoming customers while driving long-term growth.
Marketing Funnel Stages and Their Goals
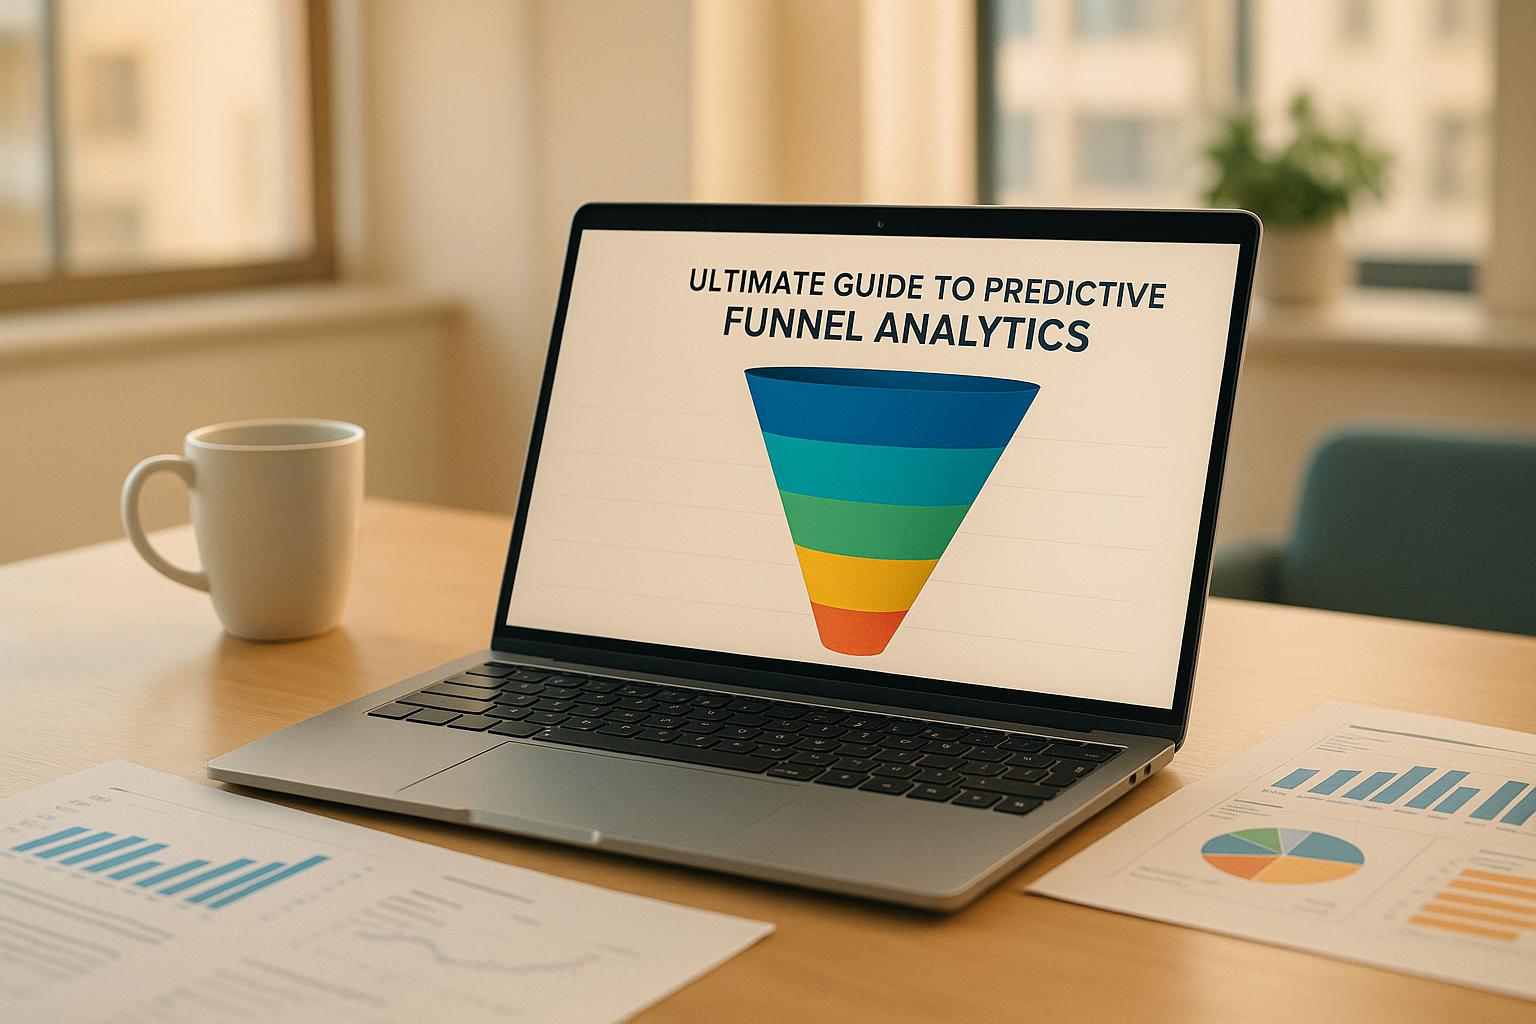
The 3 Main Funnel Stages
Most businesses break down the customer journey into three key stages: Awareness, Consideration, and Conversion. While some models also include a retention stage, this guide focuses on these core three.
Here’s the challenge: 84% of shoppers begin their product searches off-brand. This means your funnel must grab attention wherever potential customers are browsing. Adding to the complexity, the digital purchase journey is far from linear.
Each stage of the funnel has a distinct role in moving someone closer to becoming a customer. The Awareness stage is all about grabbing attention. The Consideration stage builds trust and educates prospects. Finally, the Conversion stage removes obstacles and seals the deal.
Understanding these stages helps you define clear goals for each part of your funnel.
Matching Goals to Each Stage
Awareness Stage Goals focus on expanding your reach and building recognition. A great example comes from Pip & Nut, which leveraged Sponsored Display ads and Sponsored Brands video in their strategy. The result? An impressive 871% increase in total ad-attributed new-to-brand sales.
Consideration Stage Goals center on educating and nurturing potential customers. Vanicream, a skincare brand, used Amazon DSP display ads, Sponsored Brands, and Sponsored Brands video to drive traffic to their Brand Store. This approach led to a 99% rise in monthly shipped cost of goods and a 187% jump in Subscribe & Save sales.
Conversion Stage Goals aim to eliminate friction and close the sale. Sensibo, for instance, partnered with Wise Commerce and used Sponsored Products to drive conversions. Their efforts delivered a 111% year-over-year boost in new-to-brand sales in the U.S..
Each stage requires tailored content and messaging. As Colleen Barry, Head of Marketing at Ketch, explains:
"Content isn't just about attracting clicks, it's about guiding potential customers through a decision-making process. If your content doesn't match their stage in the journey, you'll either overwhelm them with too much information too soon or leave them hanging without enough details to make a decision."
This principle applies not just to content but also to how success is measured. Smart businesses think beyond immediate conversions, focusing on long-term growth. Take Sika’s partnership with Amazon Ads in Spain, for example. Their full-funnel approach boosted their click-through rate by 57% above benchmarks and achieved a 5% increase in aided awareness.
Julie Amanda Nyholm Petersen, Head of Social Marketing Media Group Worldwide, highlights the importance of this comprehensive approach:
"Time and time again, I see advertisers make one big mistake when media planning. They invest only in low funnel campaigns. It might be the right strategy in the short run, but choosing the full-funnel approach is key to long-term media planning and scaling a business."
For more tips on optimizing your funnel strategy, check out the Marketing Funnels Directory (https://topmarketingfunnels.com).
Focus on tracking the metrics that matter, most aligned to your customer’s needs - Becky Simms
Choosing the Right Metrics for Each Stage
When it comes to measuring the success of your funnel, picking the right metrics is a game-changer. The goal isn’t just about gathering data - it’s about focusing on metrics that clearly reflect the objectives of each funnel stage. Funnels tend to falter when the metrics don’t align with their purpose.
Top of Funnel Metrics
At the Awareness stage, the mission is simple: get your brand in front of as many eyes as possible and make an impression. To measure how well you’re doing, keep an eye on website traffic from various sources - organic, referral, and paid. Engagement metrics like impressions, bounce rate, and time on page are also key. For example, if you’re seeing high traffic but an equally high bounce rate, it could mean your messaging isn’t connecting with visitors. On the other hand, low traffic paired with strong engagement might signal a need to expand your distribution efforts.
Middle of Funnel Metrics
In the Consideration stage, potential customers are sizing up your offerings to see if they meet their needs. Metrics like lead generation rate, lead quality, and lead engagement rate are crucial here. Studies show that nearly half of buyers - 47% - consume 3 to 5 pieces of content before they even think about reaching out to a sales rep.
Real-world examples illustrate how small tweaks can make a big difference. One Dashly client boosted their email open rate from 40% to 60% by fine-tuning subject lines and timing. Another saw a 20% jump in their lead-to-meeting conversion rate by using automated chatbots. Personalization also plays a massive role at this stage: personalized calls-to-action can improve performance by 202%, and using videos can increase conversion rates by 66%.
Once you’ve nurtured your leads, it’s time to focus on closing the deal.
Bottom of Funnel Metrics
The Conversion stage is where the magic happens - turning prospects into customers. Metrics like conversion rates, Customer Acquisition Cost (CAC), and Return on Ad Spend (ROAS) are essential here. David Bushell, Director at AdGrow, breaks it down:
"CPA is defined by the cost per click and the conversion rate. Those are the two things that create CPA. As an advertiser, those are your levers to improve and change CPA."
Jeff Coleman, Leader of Digital Marketing Science at Carter’s, adds:
"What you want to know as a marketer is, 'What are we getting incrementally for our investment?' So, that's what iROAS gives us. It gives us a true understanding of what is the incremental impact that every dollar is making on driving the business."
There are plenty of ways to fine-tune this stage. For instance, one Dashly client reduced their drop-off rate at the “meeting booked” stage from 40% to 25% by focusing on targeted outreach and better lead nurturing. Another improved their qualification rate from 25% to 40% by refining their lead scoring process. Retargeting ads can also work wonders, increasing conversion rates by up to 147%. While the average conversion rate for a sales funnel landing page sits at 2.35%, the best-performing funnels often hit rates of 5.31% or more.
| Funnel Stage | Key Metrics | What They Measure |
|---|---|---|
| Top of Funnel (Awareness) | Traffic, Impressions, Bounce Rate, Time on Page | Reach, engagement, and content relevance |
| Middle of Funnel (Consideration) | Lead Generation Rate, Lead Quality, Lead Engagement Rate | Nurturing effectiveness and prospect interest |
| Bottom of Funnel (Conversion) | Conversion Rates, CAC, ROAS | Sales efficiency and profitability |
sbb-itb-a84ebc4
How to Pick Good Metrics
Not all metrics are created equal. The success of your funnel often hinges on selecting the right numbers to monitor. The trick is identifying metrics that genuinely drive progress at each stage of the funnel.
Relevance and Actionability
A strong metric should align closely with your funnel's goals and provide clear guidance for improvement. Relevance ensures the metric tracks progress toward your specific objectives, while actionability means it points to concrete steps you can take.
Take website traffic as an example. While it’s relevant for the awareness stage, it’s not actionable unless you know where the traffic originates. Breaking it down by source - organic, social, or paid - can uncover actionable insights. For instance, if organic traffic is low, you might prioritize SEO efforts. If social traffic isn’t converting, it may signal the need to refine your content strategy.
Email open rates during the consideration stage are both relevant and actionable. They indicate how well your nurturing content is resonating, and you can test subject lines, sending times, or even sender names to improve performance. On the other hand, tracking total company revenue while testing a top-of-funnel landing page isn’t actionable because too many variables affect the final outcome.
The bottom line? Your metrics should align with the behaviors and goals specific to each funnel stage.
Measurability and Stage Fit
Your metrics need to be measurable with the tools and data you have on hand. If you can’t reliably collect or interpret the data, the metric won’t add much value.
Each funnel stage reflects different user behaviors, so your metrics should match those actions. For the awareness stage, impressions and initial engagement are logical metrics. Measuring purchase intent here would be premature. In the consideration stage, metrics like lead quality and content engagement are more insightful. At the conversion stage, focus on metrics like conversion rates and cost per acquisition.
Timeliness also matters. Metrics should update quickly enough to guide decisions in real time. For example, if you’re running a two-week A/B campaign, a metric that takes three months to show meaningful results won’t help you optimize effectively.
| Metric Quality | Good Example | Poor Example | Why |
|---|---|---|---|
| Relevance | Email click-through rate for nurturing campaigns | Total website sessions for email performance | Click-through rate measures email engagement directly. |
| Actionability | Bounce rate by traffic source | Overall brand awareness | Traffic source data can guide specific optimizations. |
| Measurability | Conversion rate from analytics | "Customer satisfaction" without surveys | Conversion rate relies on clear, trackable data. |
| Stage Fit | Lead generation rate in the consideration stage | Purchase rate in the awareness stage | Matches the typical behavior for that funnel stage. |
Connecting A/B Testing Metrics to Funnel Goals
Once you've identified the right metrics for each stage of your funnel, the next step is to directly tie your A/B tests to those objectives. This alignment ensures your experiments provide actionable insights and lead to meaningful performance improvements.
Finding the Right Funnel Stage to Test
Start by analyzing your conversion data to pinpoint where users drop off. For example, if 1,000 visitors land on your page but only 50 sign up for your email list (a 5% conversion rate), it’s clear the awareness stage needs attention. On the other hand, if 500 users add items to their cart but only 100 complete their purchase (a 20% conversion rate), the decision stage might be the problem.
Each funnel stage presents unique testing opportunities:
- At the top of the funnel, experiment with elements like headlines, value propositions, or CTA buttons.
- In the middle, focus on email subject lines, content formats, or lead magnets.
- At the bottom, try optimizing checkout processes, pricing displays, or urgency signals.
For instance, when Instapage revamped the layout of their webinar landing page to improve the transition from awareness to consideration, they saw a 129% increase in webinar sign-ups. This example highlights how tailoring your tests to specific funnel stages can yield substantial results. Once you've chosen your focus, it’s time to establish clear benchmarks.
Setting Benchmarks and Success Targets
Before running any tests, define benchmarks based on your current performance. For example, if your email open rate stands at 22%, aim for a target like 25% or higher. Create hypotheses that are specific and measurable, such as, "Changing the CTA button color from blue to orange will increase email sign-ups by 15%."
It's also essential to set both primary and secondary goals. This prevents the risk of improving one metric at the expense of another. Noah Kagan from AppSumo demonstrated this approach when testing headlines for a course sales page. By setting clear benchmarks and measurable goals, they achieved a 6.49% increase in course sales with their winning variation.
Keep your goals focused and actionable. Instead of vague targets like "improve user experience", aim for concrete results, such as increasing form completion rates from 12% to 15%.
Combining Numbers with User Feedback
While metrics provide valuable insights, understanding the "why" behind the numbers is just as important. Use tools like interviews, surveys, or session replays to gather user feedback. For example, if users are abandoning their carts, feedback might reveal issues like confusing shipping costs or concerns about payment security.
A SaaS company noticed only 10% of users were engaging with a new feature. After gathering feedback, they discovered the interface was too complex. They simplified the design, ran usability tests, and saw feature engagement jump by 50% in just one month.
Qualitative feedback helps explain test results and guides future improvements. For instance, Just Rewards tested a redesign of their lead capture form. By combining data with direct user insights, they created a version that felt more trustworthy and easier to use, leading to a 16% increase in form completions.
Key Points for Aligning Metrics with Funnel Goals
To optimize your funnel effectively, it's crucial to pick metrics that align with your business goals for each stage. Focus on the top (traffic and engagement), middle (lead quality), and bottom (conversion efficiency) stages of the funnel. This approach ties back to the earlier discussion on tailoring metrics to specific objectives.
Use a mix of leading indicators - like email open rates and click-through rates - and lagging indicators, such as revenue and lifetime value. Together, they provide a complete picture of your funnel's health, helping you spot problems quickly and measure the impact of your efforts.
It's important to distinguish between funnel metrics and overall KPIs. Funnel metrics track daily activities within each stage, while KPIs measure broader business achievements over time. This distinction ensures that every test and optimization effort remains focused and effective.
A/B testing is a powerful tool for funnel optimization. By tailoring tests to specific funnel stages, you can make meaningful improvements in conversion rates. This targeted strategy enhances the performance of the entire funnel.
For B2B funnels, the focus often lies on lead quality and the length of the sales cycle. In contrast, B2C funnels prioritize acquisition costs and order values.
Lastly, regularly review your metrics and foster collaboration across teams to adapt to changing market conditions. Consistent measurement, testing, and refinement are essential to ensuring that every funnel stage contributes to your overall success.
FAQs
How can businesses align metrics with each stage of the marketing funnel to drive meaningful results?
To make sure your metrics align with each stage of the marketing funnel, start by identifying the key performance indicators (KPIs) that correspond to the goals of each stage - whether it's awareness, consideration, or conversion. For instance, at the top of the funnel, focus on metrics like impressions and click-through rates. As you move to the bottom of the funnel, shift your attention to conversion rates and customer retention.
It's important to regularly review and analyze your data to ensure your metrics remain useful and actionable. These insights can help you fine-tune your strategies, address any weak areas, and boost overall performance. By taking this structured approach, you’ll gain stage-specific insights that allow you to optimize the entire customer journey more effectively.
What are common mistakes businesses make when choosing metrics for each funnel stage, and how can they fix them?
One common misstep is choosing metrics that don't match the specific goals of each stage in the funnel. For instance, relying on vanity metrics like total website traffic instead of actionable ones like conversion rates can paint an inaccurate picture. Another frequent issue is not connecting metrics to specific actions within the funnel - for example, tracking engagement without evaluating its effect on lead generation or sales.
To steer clear of these errors, businesses should:
- Set clear objectives for every funnel stage, whether it's awareness, consideration, or conversion.
- Select relevant KPIs that align with those objectives, such as lead quality, customer retention, or engagement levels.
- Regularly evaluate and adjust metrics to ensure they stay actionable and in sync with your funnel strategy.
By zeroing in on metrics that genuinely support your funnel's goals, you can make smarter decisions and achieve results that truly matter.
How can user feedback and funnel metrics work together to improve A/B testing results?
Combining user feedback with funnel metrics gives you a well-rounded view of your A/B testing outcomes. Funnel metrics show you what’s happening at each step of the customer journey, while user feedback digs into the why behind those numbers - why one variation outperforms another.
By merging these insights, you can make smarter decisions, refine the user experience, and ensure changes align with what customers want. The result? Better conversion rates and a smoother funnel overall.