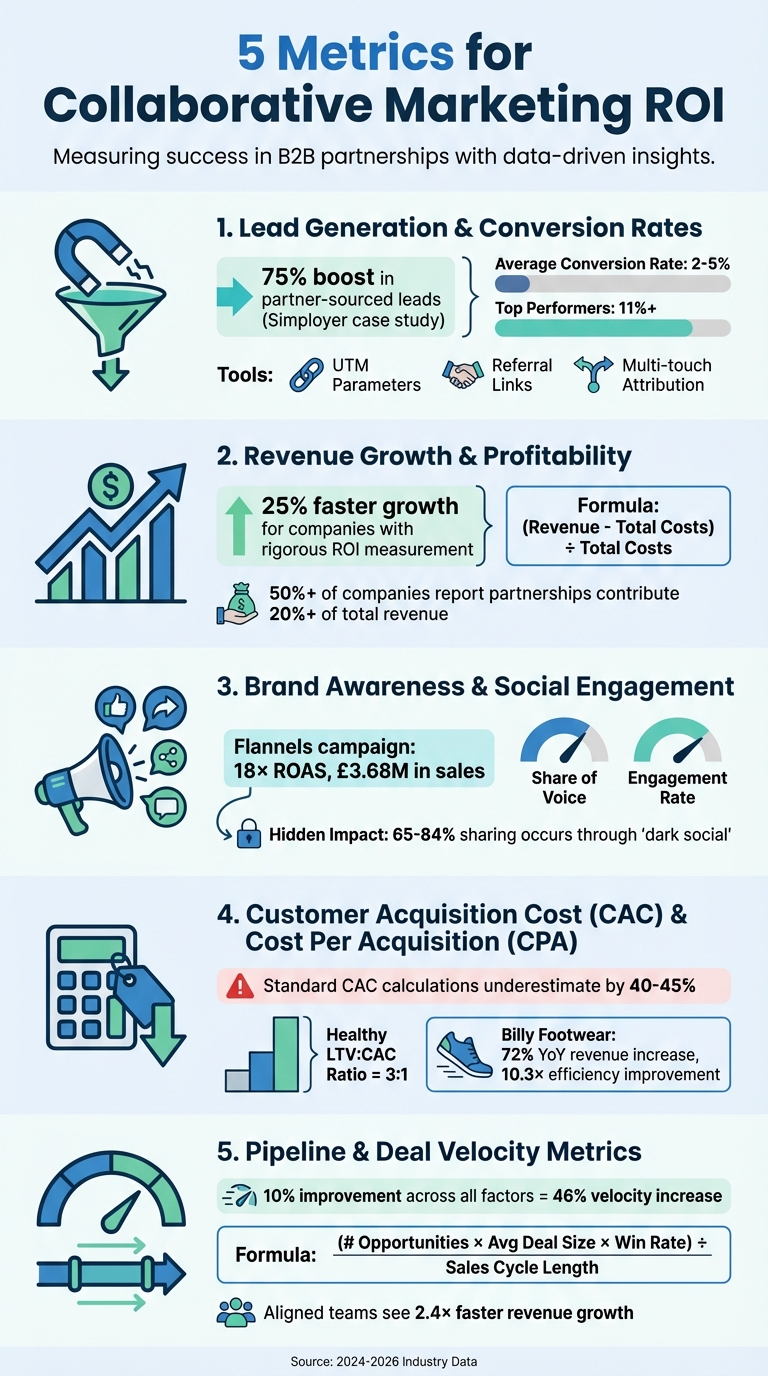
Collaborative marketing can drive growth, but measuring ROI is critical to avoid failed partnerships. Here are five key metrics to track for success:
- Lead Generation and Conversion Rates: Measure partner-driven leads and their quality. Marketing funnel software like referral links and UTM parameters help identify top-performing partners. Focus on conversion rates to ensure leads align with your Ideal Customer Profile.
- Revenue Growth and Profitability: Analyze revenue and margins to identify efficient partnerships. Use metrics like Customer Lifetime Value (CLV) and multi-touch attribution to understand long-term impact.
- Brand Awareness and Social Engagement: Track metrics like Share of Voice and engagement rates to evaluate how partnerships expand your brand's reach. Include "dark social" activity and assisted conversions for a fuller picture.
- Customer Acquisition Cost (CAC) and Cost Per Acquisition (CPA): Calculate the true cost of acquiring customers by factoring in all partnership-related expenses. Compare CAC to Lifetime Value (LTV) for a balanced view of profitability.
- Pipeline and Deal Velocity Metrics: Measure how quickly partner-driven deals move through your sales process. Faster cycles mean more efficient partnerships.
5 Key Metrics for Measuring Collaborative Marketing ROI
How To Measure The ROI Of A Marketing Strategy - Examples Shown
sbb-itb-a84ebc4
1. Lead Generation and Conversion Rates
After diving into the importance of systematic ROI tracking, it’s time to focus on lead generation and conversion rates - two metrics that reveal whether your partnerships are truly delivering value. These numbers help you understand if the right audience is being reached and, more importantly, if that audience is taking meaningful action. Without tracking them, it’s nearly impossible to distinguish between high-performing partners and those who aren’t pulling their weight.
Tools like unique referral links and UTM parameters make it easy to pinpoint which partner is driving which leads. For example, in 2025, Simployer, a Nordic HR tech company, used the Journeybee PRM platform to automate lead-sharing processes. This eliminated manual data entry and led to some impressive results: a 75% boost in partner-sourced leads, a 25% increase in partner-influenced revenue, and a reduction of 20 hours in weekly administrative work. On top of that, onboarding new partners sped up by 85%.
But let’s be clear: lead volume isn’t everything. Conversion rates are what really show the quality of those leads. Are your partners connecting with your Ideal Customer Profile, or are they just generating unqualified traffic?
Will Chin, Demand Generation Manager at PartnerStack, explains it well: "If a partner is driving a low number of leads but they are converting at a high volume, you might want to help them drive more leads".
This focus on lead quality ties directly to ROI, aligning partner efforts with your overall revenue goals. For context, the average marketing conversion rate ranges from 2% to 5%, while top performers achieve 11% or more.
To get the full picture, multi-touch attribution is essential. Unlike last-click models, multi-touch attribution gives credit to partners who contribute at earlier stages of the customer journey. By 2026, businesses were using real-time dashboards and AI-driven tools to monitor conversion rates. For instance, if a partner’s conversion rate drops from 0.8% to 0.3%, these tools can flag the issue immediately, allowing teams to take swift action.
Establish clear Marketing Qualified Lead (MQL) criteria and leverage automated lead distribution systems to notify your sales team the moment a partner submits a qualified lead. Regular incremental lift analysis can also help ensure that partner-driven leads are genuinely adding value, rather than simply capturing customers who would’ve converted on their own. By fine-tuning these processes, you can make your partnerships more consistently profitable.
Next, we’ll dive into revenue-related outcomes to further validate the impact of these partnerships.
2. Revenue Growth and Profitability
Tracking revenue growth and profitability is essential to demonstrate how collaborative marketing impacts the bottom line. Revenue reflects total income, while profitability shows whether that income exceeds the partnership's total costs.
Here’s an example from 2024: A B2B SaaS company evaluated three system integrator partners over nine months. Partner A generated $800,000 in revenue at 35% margins with a 92% customer satisfaction score. Partner B delivered $500,000 at 18% margins with a 71% satisfaction score. Partner C brought in $200,000 at 45% margins with a 95% satisfaction score. While Partner A had the highest revenue, Partner C emerged as the most efficient contributor.
As InfluenceFlow explains: "A partner generating $1M in revenue at 40% margins contributes $400K profit. Another partner with the same revenue but 20% margins contributes only $200K profit. Margin analysis reveals which partnerships are truly valuable".
To calculate true profitability, subtract every cost - partner commissions, salaries, content creation, platform fees, and subscriptions - from revenue. Use this simple formula: (Revenue - Total Costs) ÷ Total Costs. This straightforward approach helps establish a foundation for tracking partner-driven deals, especially when integrated with CRM systems like HubSpot.
Companies that implement rigorous ROI measurement grow 25% faster than those that don’t. Still, 73% of marketers struggle to prove campaign effectiveness.
Tools like multi-touch attribution and CRM integration can help track partner-driven deals from the first interaction to closed sales. For longer sales cycles, consider tracking Marketing Qualified Leads (MQLs) and assigning them a monetary value based on historical conversion rates. This provides an estimate of revenue before deals are finalized. However, avoid measuring ROI too soon - campaigns often require 60 to 90 days to capture the full customer journey.
Customer Lifetime Value (CLV) is just as important as initial revenue. Customers acquired through partnerships may have different retention patterns and could drive higher long-term profitability.
It’s worth noting that more than 50% of companies report partnerships contribute over 20% of their total revenue.
3. Brand Awareness and Social Engagement
Metrics for brand awareness highlight how partnerships can amplify your visibility and establish trust with new audiences. When a collaborator introduces your brand to their community, it often builds credibility, which can be measured to validate the return on investment (ROI) of your collaborative marketing strategy.
A key metric to monitor is your Share of Voice, which reflects your brand's presence in the market. To calculate it, divide your brand mentions by the total mentions in your industry, then multiply by 100. This shows the percentage of the conversation your brand commands. Keep in mind, mentions can include direct tags (like @brandname) as well as untagged references. Social listening tools are essential here, as they can help track misspellings and informal mentions, giving you a fuller picture.
Another crucial metric is engagement rate, which provides a better sense of audience interest than simply counting followers. You can calculate it by dividing total engagements by impressions and multiplying by 100. Focus on high-value interactions, such as saves and shares, rather than passive likes. For instance, accounts with 1,000 to 5,000 followers often see an average growth rate of 38%, while those with 10,000 to 50,000 followers grow at about 33.8%.
A great example of effective collaboration comes from retailer Flannels. In late 2024, they teamed up with influencers for the #PartyNeverStops campaign on TikTok to promote festive clothing. The campaign reached 11.9 million unique users in the UK, generated £3.68 million in sales with an 18× return on ad spend, and garnered over 91 million video views.
It's also worth noting that 65% to 84% of social sharing occurs through "dark social" channels, such as WhatsApp or email - platforms that traditional analytics tools often overlook. To capture this hidden activity, consider using post-purchase surveys with questions like "How did you hear about us?" Additionally, tracking assisted conversions - where social media influences the buyer's journey without being the final click - can offer deeper insights. These conversions often account for 30% to 60% of social media's true revenue impact. By combining these approaches, you can better understand how collaborative efforts enhance visibility and cost efficiency.
4. Customer Acquisition Cost (CAC) and Cost Per Acquisition (CPA)
While lead generation and revenue metrics help confirm value, measuring costs through CAC (Customer Acquisition Cost) and CPA (Cost Per Acquisition) is essential for understanding the ROI of collaborative marketing efforts. CPA focuses on the cost of specific campaign actions - like a lead signup or webinar registration - while CAC encompasses the total expense of acquiring a paying customer, including both direct and indirect costs. CPA fine-tunes individual strategies, while CAC offers a broader view of your long-term viability.
However, standard CAC calculations often miss the mark. They can underestimate actual costs by 40%–45% when only direct expenses are considered, leaving out shared costs like CRM tools, employee salaries, and sales support. For B2B companies, sales expenses alone can account for 20% to 40% of total acquisition costs. To get an accurate "True CAC", include:
- Direct partnership costs (e.g., referral fees, co-marketing spend)
- A fair share of marketing operations costs
- Sales expenses like commissions and lead qualification
Then divide the total by the number of customers acquired through that channel.
"Calculating true CAC across paid ads, content, and partner channels is a strategic imperative." - Tristen Taylor, HubSpot
A real-world example? In 2025, Billy Footwear implemented multi-touch attribution using LayerFive. By shifting its budget based on true influence rather than last-click metrics, the company achieved a 72% year-over-year increase in ad revenue while increasing ad spend by just 7%. This resulted in a 10.3× improvement in marketing efficiency. This shows the value of looking beyond surface-level metrics to uncover which partnerships yield the best returns.
Once CAC is calculated, compare it to LTV (Lifetime Value) using the LTV:CAC ratio. A healthy ratio is generally 3:1, meaning every $1 spent on acquisition should generate $3 in revenue. If your ratio dips below 3:1, you might be overspending on customer acquisition. On the other hand, a ratio above 4:1 could suggest you're being too cautious, potentially missing growth opportunities. Evaluating CAC across different partner tiers or strategies helps pinpoint the most cost-effective partnerships, enabling smarter budget allocation.
5. Pipeline and Deal Velocity Metrics
Tracking costs and conversions is essential, but pipeline velocity takes it a step further by showing how partnerships can speed up your sales process. This metric combines four key factors: the number of opportunities, average deal size, win rate, and sales cycle length. It calculates how quickly opportunities move from initial contact to closed deals. The formula is straightforward: multiply the number of opportunities by the average deal size and win rate, then divide by the sales cycle length. Breaking this down by source can highlight inefficiencies, showing which partnerships help streamline your process and which might be slowing things down. This provides a deeper layer of insight beyond standard ROI metrics by focusing on how quickly leads turn into revenue.
Comparing partner-sourced deals with direct sales can uncover efficiency gaps right away. For example, if your direct sales cycle averages six months but partner-sourced deals close in just four, that partnership is effectively saving your sales team 33% of their time for other opportunities. Similar time savings have also been seen with automated systems like Systeme sales funnels that eliminate delays in pipeline stages where deals often get stuck waiting for approvals or next steps.
"Pipeline velocity is the engine behind forecast accuracy. When velocity decelerates, and you don't catch it, forecasted revenue arrives late or not at all, even if your pipeline coverage ratio looks healthy." - Maria Akhter, Editor, Revenue Best Practices, Outreach
Pipeline velocity builds on cost and conversion metrics by showing the operational benefits of strong partnerships. For instance, improving opportunities, deal size, win rates, and cycle duration by just 10% can increase overall velocity by about 46%. Companies that align their customer-facing teams see 2.4× faster revenue growth and double the profitability growth compared to those with siloed teams. Tracking velocity by partner tier can help you decide which partnerships deserve more attention and investment, and which might need extra support to clear bottlenecks.
Conclusion
By focusing on these five metrics, you can transform collaborative marketing into a reliable, data-driven growth strategy. These metrics offer a clear view of which partnerships are worth the investment and which ones might be draining your resources. In fact, over half of businesses now report that partnerships account for more than 20% of their total revenue. This highlights how essential accurate measurement is - not just for justifying marketing budgets but also for proving ROI to leadership.
As we’ve seen, precise tracking can turn unpredictable partnerships into dependable revenue streams. But the bigger challenge lies in ensuring that marketing and sales teams work in sync. Misaligned teams often face sales cycles that are up to 37% longer than those that are aligned. Take Simployer, a Nordic HR tech company, as an example. By adopting a unified CRM and PRM system, they streamlined their processes and significantly boosted team efficiency.
Shweta Pandey, CEO of Marketboats, explains it perfectly: "When marketing and sales stop arguing about whose fault it is and start working from the same data, the culture shifts. Beyond the numbers, RevOps transforms the dynamic and the blame game dissolves".
When teams share the same data, internal conflicts fade, and overall operations improve. Achieving this alignment involves agreeing on shared definitions for lead stages, integrating CRM and PRM tools, and conducting regular cross-functional reviews. Companies that adopt these practices see a 28% boost in partner productivity and a 34% reduction in partnership churn. Additionally, moving from periodic reporting to real-time monitoring allows teams to address performance dips as they happen, rather than months down the line.
Armed with these metrics, aligning teams and strategies becomes much more attainable. For businesses aiming to refine their marketing efforts and maximize ROI, resources like the Marketing Funnels Directory provide curated tools, courses, and vendor recommendations to help you build better marketing funnels. With the right metrics, team alignment, and strategic tools, collaborative marketing can become a dependable revenue driver.
FAQs
How can I tell if partner leads are high quality?
To assess the quality of partner leads, it's important to look past just the numbers. Pay attention to metrics like conversion rates to paying customers, revenue contribution, and their influence on customer lifetime value (CLV). Also, consider how these leads impact customer acquisition costs (CAC) and retention rates. The best leads usually demonstrate strong conversion rates, support long-term growth, and align seamlessly with your business objectives.
What costs should I include to calculate true CAC for partnerships?
To figure out the true Customer Acquisition Cost (CAC) for partnerships, you need to account for all expenses involved in gaining customers through these collaborations. This includes direct costs like partner program fees and co-marketing efforts. Don’t overlook indirect costs either - things like partner management and the resources required to maintain and grow these partnerships. By factoring in both direct and indirect expenses, you’ll get a complete picture of what you’re investing to acquire customers through partnerships.
How can I track partner influence if it isn’t the last click?
To understand partner influence beyond just the last click, try using attribution models that spread credit across multiple touchpoints. Multi-touch attribution assigns a portion of the value to each interaction along the customer journey, showcasing how partners contribute at different stages. Additionally, using frameworks that separate sourced revenue from influenced revenue can help you capture the impact partners have early on, even if they aren't part of the final interaction.