I judge CTR against the channel and funnel stage, not one target. A 1% CTR may be near the cited display-retargeting benchmark but below the 2025 Google Search Ads average of 6.66%. The next question: Do those clicks lead to results?
Here’s how I assess each stage:
- Top funnel: Compare clicks with engagement and qualified visits using marketing funnel software.
- Middle funnel: Check form completion and lead quality. The cited 2025 email click-rate averages are 2.00%-2.09%.
- Bottom funnel: Follow clicks through to demos, purchases, pipeline, and revenue.
I use these ranges as starting points, then compare campaigns with the same audience, offer, page intent, and click definition. Before calling CTR weak, average, or strong, I check tracking, sample size, and downstream results.
<u>More clicks aren’t always better.</u> A lower CTR can win when it produces better leads or more revenue per click.
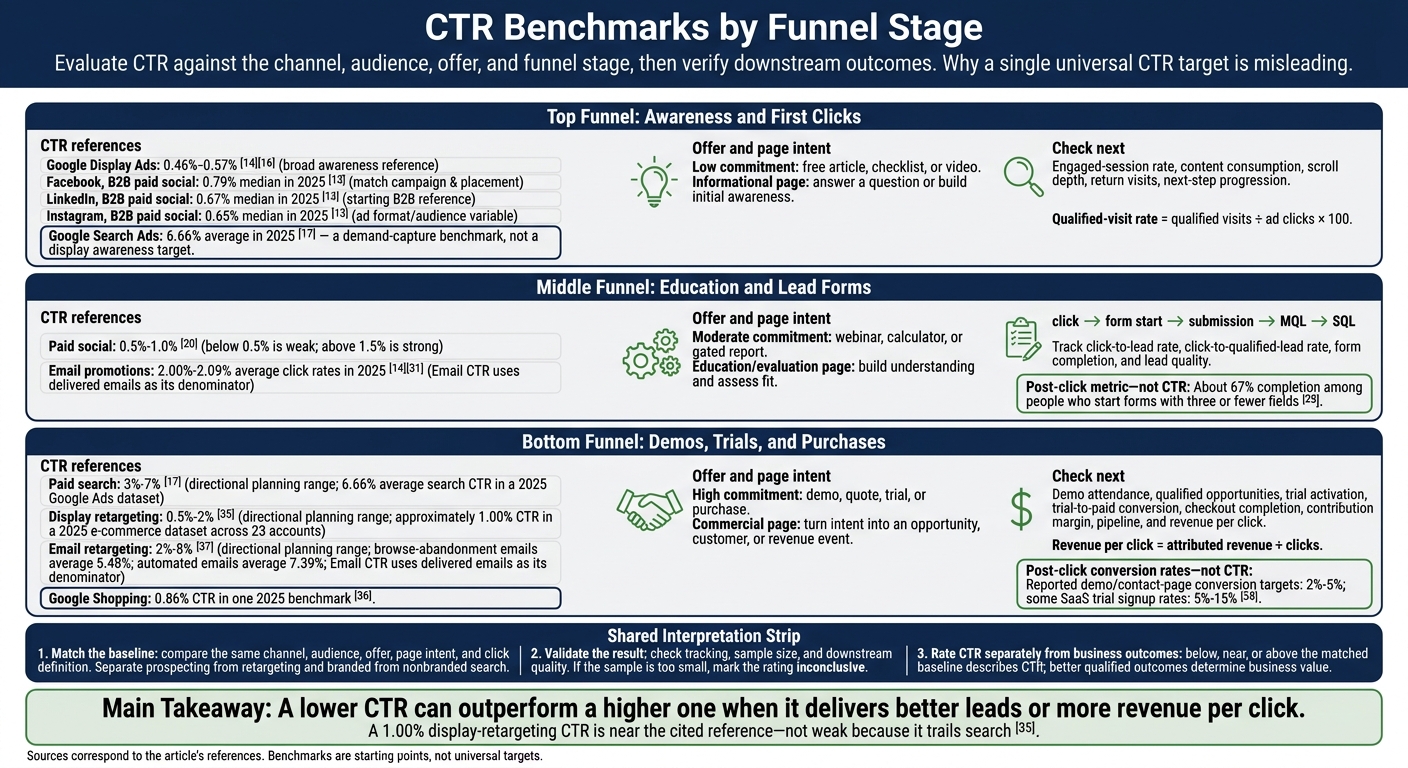
CTR Benchmarks by Funnel Stage
1. Top Funnel: Awareness and First Clicks
Channel-Specific CTR Benchmarks
Compare CTR against channel-specific benchmarks. Campaign objective, audience, placement, and ad design or copy all affect results. Keep new-audience prospecting separate from retargeting. Using the right marketing funnel tools helps track these segments accurately. A benchmark gives you a starting point, not a verdict.
| Channel | Reported CTR reference | How to interpret it |
|---|---|---|
| Google Display Ads | 0.46%-0.57% | Broad reference for awareness or other broad-reach ads. |
| Facebook, B2B paid social | 0.79% median in 2025 | Directional B2B reference; match campaign objective and placement. |
| LinkedIn, B2B paid social | 0.67% median in 2025 | Starting reference for comparable B2B campaigns. |
| Instagram, B2B paid social | 0.65% median in 2025 | Ad format and audience can change results. |
| Google Search Ads | 6.66% average in 2025 | WordStream’s demand-capture benchmark, not a display awareness target. |
Search users are already looking for information or a solution. Display and social ads interrupt browsing, so a lower CTR doesn't automatically mean weaker ads. The commitment an offer requires also affects clicks. Judge CTR alongside the quality of the visits it produces.
Offer Commitment and Page Intent
Awareness traffic should land on the page the ad promises, with one low-friction next step. That usually means an educational article, explainer, category page, research summary, or another page that answers an early-stage question.
Check engaged-session rate, scroll depth, and return visits to see whether the page delivers on that promise. Ad-to-page alignment needs even closer attention on lead-generation pages.
Qualified Visits and CTR Ratings
Define a qualified visit before launch. It might mean meaningful content engagement, additional page views, or progress toward an email signup. Track qualified-visit rate = qualified visits ÷ ad clicks × 100, broken out by channel, audience, ad version, and landing page.
Rate CTR against a matched baseline: weak below it, average near it, and strong above it when qualified-visit rate also holds. Low CTR with strong engagement calls for testing ad copy and design, not an automatic shutdown. High CTR with short sessions calls for checking the ad-to-page match, targeting, and accidental clicks.
Judge results over a full week rather than reacting to first-day noise. Middle-funnel clicks usually justify a higher CTR because the offer asks for more commitment.
sbb-itb-a84ebc4
2. Middle Funnel: Education and Lead Forms
Channel-Specific CTR Ranges
Middle-funnel CTR has no universal target. For paid social, 0.5%-1.0% is a directional range. Below 0.5% is weak; above 1.5% is strong. For email promotions, 2025 average click rates are 2.00%-2.09%. Email CTR uses delivered emails as its denominator.
As funnel intent deepens, expect CTR to increase only when the offer becomes more specific. Compare results against the same offer type and audience, using a range that matches the channel and the commitment the offer requires.
Offer Commitment and Page Intent
An ungated article usually asks for a click. A guide usually asks for contact details, while a webinar asks for time. A newsletter subscription adds a recurring commitment.
Lower-friction offers can lift CTR. Fewer clicks may reflect a bigger commitment rather than weaker messaging. A webinar page should state the schedule and time required. A guide page should explain its value and how contact data will be used.
Require only the fields needed for qualification. One benchmark reports about 67% completion among people who start forms with three or fewer fields. That measures form completion - not the share of ad clickers who become leads. The more an offer asks of someone, the more CTR depends on audience fit.
Qualified Leads and CTR Ratings
Track click → form start → submission → MQL → SQL, and report both click-to-lead and click-to-qualified-lead rates. Sync submissions to CRM records with campaign, source, and offer data. Before launch, define qualification by job role, company size, industry, and use case.
Rate CTR against a baseline matched to the stage, channel, and offer. Then check downstream rates. Above-baseline CTR is still weak if form completion or qualified-lead yield falls. Bottom-funnel benchmarks increase again when the click signals active buying intent.
B2B SaaS LinkedIn Ads CTR Benchmarks (2026)
3. Bottom Funnel: Demos, Trials, and Purchases
At the bottom of the funnel, CTR matters only if it leads to revenue.
Channel-Specific CTR Ranges
Buying intent doesn't guarantee a higher CTR, especially in retargeting. Treat these ranges as planning guides, not universal targets. Separate branded from nonbranded search, and measure email CTR using delivered emails.
| Channel | Directional CTR range | Supporting reference |
|---|---|---|
| Paid search | 3%-7% | A 2025 Google Ads dataset reports a 6.66% average search CTR. |
| Display retargeting | 0.5%-2% | A 2025 e-commerce dataset across 23 accounts reports approximately 1.00% CTR. |
| Email retargeting | 2%-8% | Browse-abandonment emails average 5.48%; automated emails average 7.39%. |
Keep Shopping separate from search text ads. One 2025 benchmark reports 0.86% CTR for Google Shopping, despite its commercial intent. Smaller retargeting audiences see the same ads repeatedly, which can cause ad fatigue. A lower CTR can still deliver better results if it produces more qualified pipeline or purchases.
As buying intent deepens, matching the landing page to that intent matters more than the click rate alone.
Offer Commitment and Page Intent
Demos, trials, and purchases ask for different levels of commitment. A demo asks for a sales conversation. A trial may require account setup or a card. A purchase requires payment.
Reported demo/contact-page conversion targets are 2%-5%, while some SaaS trial signup rates reach 5%-15%. These are post-click conversion rates, not CTR benchmarks. Send evaluation traffic to pricing or comparison pages, and recovery traffic to the relevant cart or product pages.
Sales Outcomes and CTR Ratings
Track demo clicks through to qualified opportunities, closed-won customers, and revenue. For trials, measure activation and trial-to-paid conversion. For purchases, track checkout completion, contribution margin, and ROAS.
Revenue per click = attributed revenue ÷ clicks. Use pipeline per click while B2B deals remain open.
Rate CTR as weak when it falls below a matched baseline and average when it sits near that baseline. Call it strong only when above-baseline clicks maintain sales quality and cost efficiency.
A 1.00% display-retargeting CTR is near the cited reference - not weak because it trails search.
For retargeting, use a holdout group to measure incremental purchases.
How Offers and Page Intent Affect CTR
The same CTR can mean different things at different funnel stages. CTR reflects the offer’s promise, not whether the page delivers on it. Compare like-for-like offers within the same channel, audience intent level, placement, and device mix. Without that context, a strong CTR can be misleading.
| Funnel stage | Typical offer | Expected commitment before clicking | Page purpose | What CTR signals | Trade-off |
|---|---|---|---|---|---|
| Top | Free article, checklist, video | Low: read, watch, or learn | Informational: answer a question or build initial awareness | Attention; check engaged sessions, content consumption, scroll depth, and return visits | Broad reach, but limited immediate identification |
| Middle | Webinar, calculator, gated report | Moderate: spend time or share contact details | Education/evaluation: build understanding and assess fit | Interest; check form completion, cost per lead, and lead-to-opportunity rate | Identifiable prospects, but fewer completions and possible interest in the asset rather than the product |
| Bottom | Demo, quote, trial, purchase | High: begin a commercial decision | Commercial: turn intent into an opportunity, customer, or revenue event using a sales funnels tool | Entry; check completed conversions and qualified pipeline | Lower volume, but greater potential value per action |
These are typical roles, not fixed labels. Judge informational pages by engagement, evaluation pages by completion and lead quality, and commercial pages by conversion and pipeline.
Separate expected commitment from unexpected friction. Slow pages, too many fields, and required account creation can all add friction after the click. Track form starts separately from completions. Strong CTR paired with frequent abandonment points to a page problem, not a weak offer.
An informational page may aim to earn qualified visits, return visits, and assisted conversions rather than immediate email capture. Assess the offer against that purpose before calling its results weak, average, or strong. Otherwise, optimizing for subscriptions can reward easy signups while overlooking useful engagement.
How to Judge Weak, Average, and Strong CTR
Use stage-specific benchmarks for an initial check, then use internal history and downstream results to assess performance. Rate CTR separately from business outcomes. If the sample is too small, mark the rating inconclusive.
| Funnel stage | Weak-performance signal | Average-performance signal | Strong-performance signal | Check next |
|---|---|---|---|---|
| Top | Below the matched baseline, with weak engagement | Within the matched baseline, with normal engagement | Above the matched baseline, with engagement maintained | Engaged-session rate, content consumption, return visits, and next-step progression |
| Middle | Few completed forms or poor-quality leads | Expected form completion and qualified-lead rate | More qualified leads without worse cost or quality | Form starts and completions, valid-submission rate, qualified-lead rate, and sales acceptance |
| Bottom | Few attended demos or inefficient opportunities | Expected conversion and pipeline results | Better opportunity and revenue per click, even with lower CTR | Demo attendance, cost per qualified opportunity, pipeline, and revenue or expected revenue per click |
The rating is only as reliable as the tracking and sample size behind it.
Choose a Matched Baseline
Use a rolling median or historical distribution from comparable campaigns as your reference. Match the channel, audience, offer, and click definition. Keep prospecting separate from retargeting, and branded search separate from nonbranded search. Use peer benchmarks with clear methods only when internal history is too thin.
Verify Tracking and Business Outcomes
Confirm the rating by recording impressions or delivered emails, clicks, conversions, and qualified outcomes. Keep attribution windows consistent.
Audit duplicate events, redirects, UTM parameters, and cross-domain tracking. Where possible, exclude bots, accidental clicks, and email-security scanner activity. Investigate sub-second clicks and all-link-click patterns. Label observed, modeled, or attributed results separately to account for measurement gaps caused by privacy and consent requirements.
For commercial campaigns, calculate expected revenue per click = qualified opportunities per click × close rate × expected contract value. Use comparable, mature sales cohorts, and keep this estimate separate from closed revenue. A lower CTR earns a stronger business rating when opportunity quality, cost per opportunity, or revenue per click improves.
Run Tests with Enough Data
Change 1 major variable per test. Define the metric, baseline, minimum detectable effect, sample size, duration, and stopping rule before the test starts. Don't call a winner early.
Report impressions, clicks, CTR, and an uncertainty interval. Small differences with broad uncertainty are promising, but inconclusive - and no CTR lift is a win if qualified outcomes deteriorate. 80% power and a 5% significance level are common planning choices.
Conclusion: Use Benchmarks That Fit Your Campaign
Treat CTR as a signal for each funnel stage, not a universal score. Compare segments with the same stage, offer, and page intent. Start with your internal history, then use external ranges as a secondary check.
A lower CTR can outperform a higher one if it delivers more revenue per click or better pipeline quality. Clicks matter only when they improve the next stage’s outcome.
FAQs
How do I benchmark CTR without historical data?
Use industry-standard CTR ranges to set initial expectations. For B2B search, positions 1–3 typically see a 10–30% CTR, while positions 4–10 see 3–10%. Marketing emails average 2–5%. Video platform rates vary: YouTube sees 4–5%, and Facebook sees 1–2%.
Then use A/B testing to refine performance. Test one variable at a time, such as CTA text, design, or placement, so you can see what drives the change. Consult the Marketing Funnels Directory for specialized funnel tools and software.
How much data do I need to judge CTR?
Use a large enough sample so random chance doesn't skew your CTR results. Run tests until they reach statistical significance. In B2B funnels, this typically takes 4 to 6 weeks to reach a 95% confidence level.
Review CTR alongside bounce rates or conversion rates to better understand user engagement and funnel performance.
What should I test first if CTR is weak?
Start with the funnel stage that has the highest drop-off rate to tackle the biggest bottleneck. If CTR is low, review your headlines, meta descriptions, and keyword targeting to see whether they match user intent. If CTR stays low, A/B test one variable at a time, such as CTA button text, design, or placement.