B2B funnels lose prospects at every stage, but knowing where and why can help you fix the leaks. Here's what you need to know:
- Drop-off rates matter: High drop-offs mean lost revenue. For instance, 79% of prospects leave at the awareness stage, 50% at interest, and 40% churn after purchase.
- Industry averages: Visitor-to-lead rates are 1–3% for most B2B companies, with top performers hitting 5–12%. Industry-specific rates vary - Professional Services lead at 3–6%, while Manufacturing lags at 1.5–3%.
- Key metrics: MQL-to-SQL conversions average 20–30%, and SQL-to-opportunity rates hover around 40%.
- Optimization tips: Use tools like A/B testing, heatmaps, and multi-channel strategies to address drop-offs. Tailor efforts to your industry - e.g., Technology firms should focus on landing pages, while Manufacturers benefit from offering demos.
Benchmarks are useful for identifying weak spots but aren't one-size-fits-all. Focus on improving your funnel while keeping your unique business context in mind.
1. B2B Funnel Drop-Off Benchmarks by Industry
Benchmark Data
Understanding where prospects drop off in the B2B funnel is crucial for identifying patterns and addressing challenges. On average, the biggest losses occur early in the funnel: 79% at the awareness stage, 50% at interest, 25% at consideration, 10–15% at decision, and 40% churn post-purchase.
Conversion rates vary widely by industry, influenced by factors like product complexity, deal size, and the length of the sales cycle. Here's a snapshot of average conversion rates across eight major B2B sectors:
| Industry | Average Conversion Rate |
|---|---|
| Professional Services | 3% - 6% |
| Financial Services | 3% - 5% |
| Technology | 2.5% - 5% |
| Education/Training | 2.5% - 5% |
| Healthcare | 2% - 4% |
| Real Estate | 2% - 4% |
| Manufacturing | 1.5% - 3% |
| E-commerce | 1.5% - 3% |
For example, professional services often achieve higher conversion rates - up to 6% - thanks to relationship-driven sales and fewer barriers to entry. On the other hand, industries like manufacturing and B2B e-commerce tend to have lower rates, reflecting longer sales cycles and higher transaction values.
These benchmarks provide a foundation for understanding how each industry's unique dynamics influence performance metrics.
Industry-Specific Insights
Conversion rates across industries are shaped by their unique challenges and customer expectations:
- Technology: With conversion rates averaging 2.5–5%, the complexity of product evaluations often slows down the buyer's journey.
- Manufacturing: Lower rates of 1.5–3% reflect extended sales cycles and the high-value nature of transactions.
- Healthcare: Regulatory requirements contribute to conversion rates of 2–4%.
- Financial Services: Established trust and credibility help achieve rates between 3–5%.
In general, industries offering high-value products experience lower conversion rates, as these transactions often involve more detailed evaluations and longer decision-making processes.
Optimization Resources
Each industry can adopt tailored strategies to address its specific challenges and reduce funnel drop-offs:
- Technology firms: Improve landing pages using analytics insights and leverage targeted email campaigns.
- Manufacturers: Provide detailed product information, along with free trials or demos, to engage potential buyers.
- Healthcare organizations: Build trust through professional, accessible content and strong lead nurturing strategies.
For businesses looking to refine their funnels, the Marketing Funnels Directory offers a range of resources. These include tools and courses designed to address industry-specific challenges, helping companies align their strategies with buyer behaviors and conversion patterns.
Across all industries, the average conversion rate is 2.9%, with form completion rates at 1.7% and call conversion rates at 1.2%. These benchmarks can serve as a useful reference point for evaluating your own funnel performance against broader market trends.
Unlocking Funnel Insights with Cohorts: Conversion, Exit Rates, and Tiering
2. Marketing Funnels Directory

The Marketing Funnels Directory is a powerful tool for companies looking to evaluate and improve their B2B funnel performance. It provides detailed data and insights that go beyond surface-level metrics, helping businesses identify where their funnels succeed - and where they fall short.
Benchmark Data
The directory offers a wealth of benchmark data, breaking down stage-by-stage conversion rates. This allows businesses to pinpoint exactly where potential customers drop off. For example, visitor-to-lead conversion rates for most B2B companies typically range between 1% and 3%. However, top-performing companies achieve rates of 5% or more, with the best reaching an impressive 8–12%. Similarly, the average lead-to-MQL (Marketing Qualified Lead) conversion rate is around 42%, but standout performers hit 50% or higher.
Interestingly, conversion rates can vary significantly based on company size. Small businesses (annual revenue of $1M–$10M) see an average visitor conversion rate of 2.3%, while enterprise-level companies (revenue over $1B) average just 0.7%. Despite this, enterprise-qualified leads tend to convert to meetings at higher rates, showing that lead quality often outweighs sheer volume.
Industry-specific benchmarks reveal even more nuances. For instance, IT & Security Software companies boast demo request qualification rates as high as 88%, while Retail & E-Commerce Software companies qualify about 30.53% of their leads.
| Company Size | Website Visitor Conversion | Lead to MQL | MQL to SQL | SQL to Opportunity |
|---|---|---|---|---|
| Small Business ($1M-$10M) | 2.3% | 37% | 32% | 40% |
| Enterprise ($1B+) | 0.7% | 34% | 40% | 36% |
These insights help businesses craft targeted strategies to improve their funnel performance.
Optimization Resources
With these benchmarks in hand, businesses can focus on addressing specific weaknesses in their funnels. The Marketing Funnels Directory provides tools and resources aimed at tackling common drop-off points.
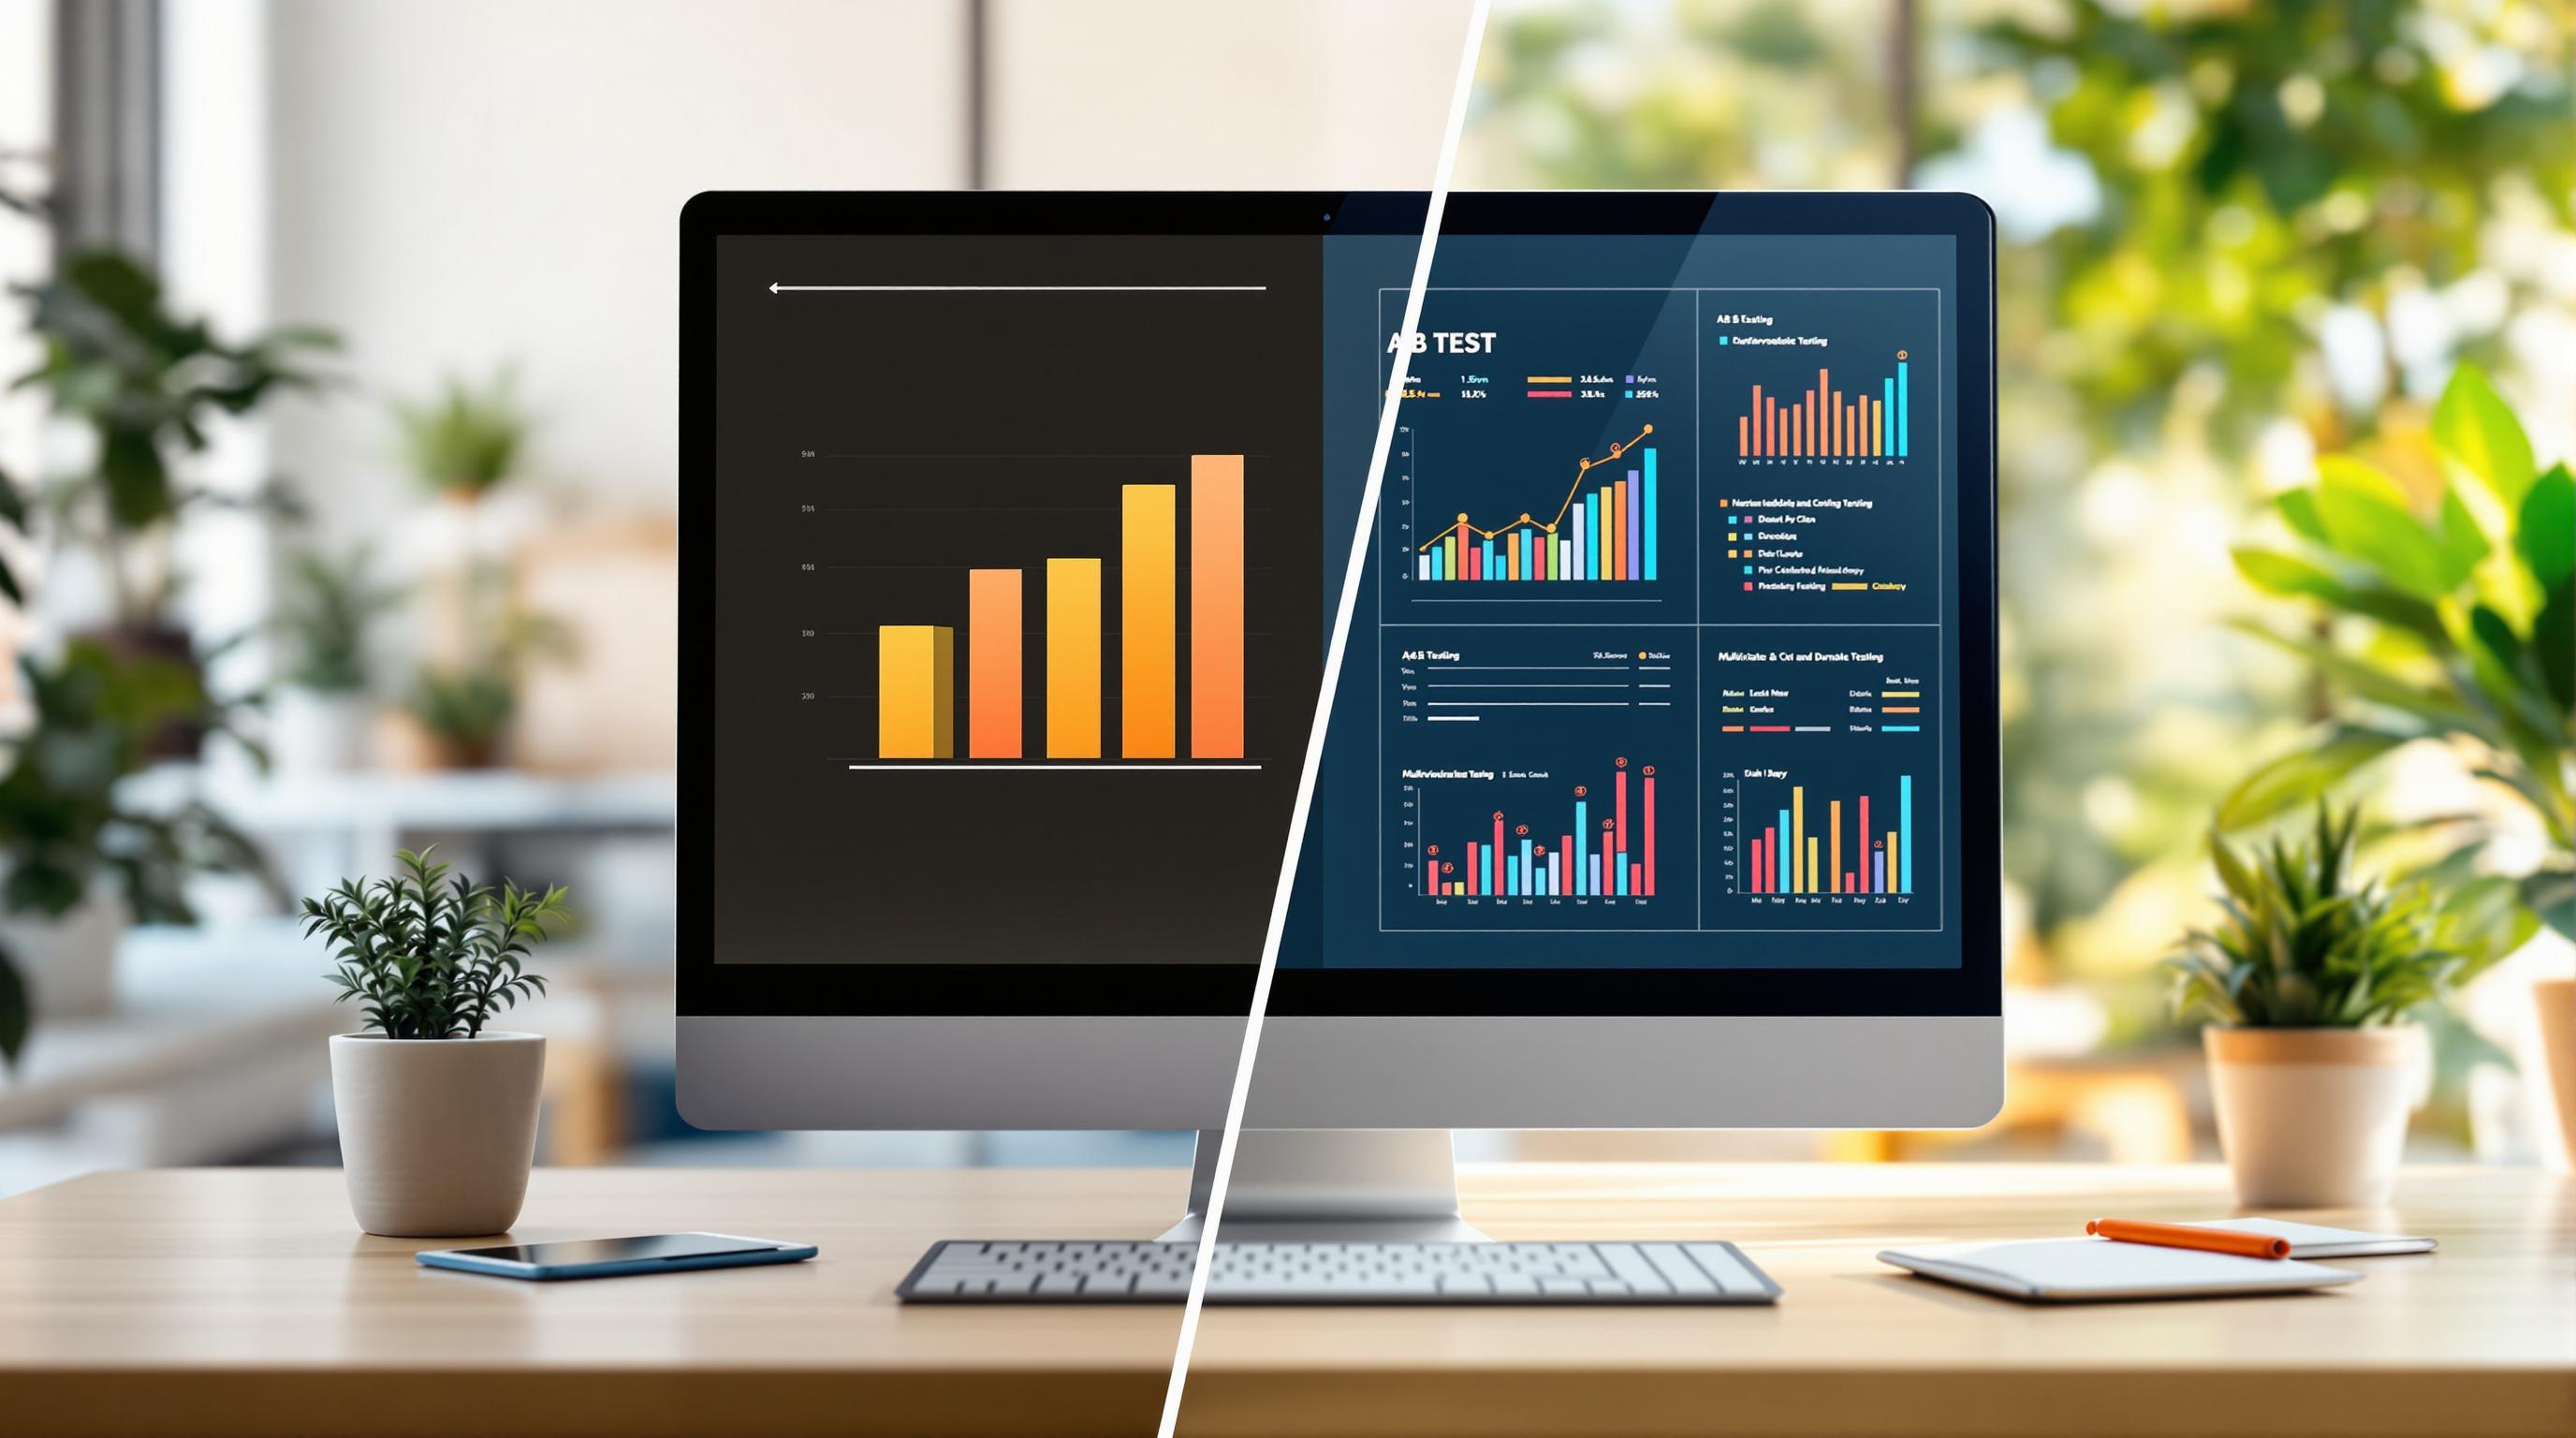
For example, A/B testing lets companies experiment with different landing page designs, email sequences, and call-to-action buttons to see what resonates most with their audience. Heatmaps and session recordings can reveal where users encounter friction, enabling teams to make data-driven adjustments.
One particularly effective strategy is simplifying the sales process to reduce customer frustration and prevent abandonment. The directory also emphasizes the importance of multi-channel marketing strategies, ensuring consistent messaging across all touchpoints. Personalization tools allow businesses to tailor their content to where a prospect is in the buyer's journey, increasing engagement and minimizing drop-offs.
Industry-Specific Insights
The directory also provides industry-specific data, which can be invaluable for refining optimization efforts. Different sectors experience varying levels of success throughout their funnels.
For example, high-performing industries like Real Estate & Property Tech, Financial/Accounting Software, and Manufacturing & Supply Chain Software often qualify more than 70% of their inbound leads, with 65–70% of those qualified leads booking meetings.
In the Developer Tools sector, companies report standout qualification rates of 88.77%, though only about 60.64% of those leads convert to meetings. Meanwhile, industries like Healthcare & Medical Software and Sales Technology attract broader audiences, which often results in lower qualification rates - 59.69% and 46.07%, respectively. However, once qualified, Healthcare software leads convert to meetings at a strong rate of 68.53%, while Sales software follows at 55.04%.
On the other hand, Customer Support software struggles with one of the weakest meeting conversion rates, highlighting the need for targeted improvements in that area. Small-business teams generally qualify 75–80% of their demo form submissions, compared to enterprise teams, which qualify about 55–60%. Despite qualifying fewer leads, enterprise teams see higher meeting conversion rates, underscoring the importance of understanding the behavior of different market segments.
sbb-itb-a84ebc4
Advantages and Disadvantages
Understanding B2B funnel drop-off benchmarks offers valuable insights, but it’s essential to weigh the benefits against the limitations when using them to guide optimization strategies.
Benchmarking pinpoints where prospects drop off in the funnel. This provides businesses with a baseline to measure their performance against industry standards, helping identify stages that need attention.
By focusing on this data, companies can implement targeted improvements at different funnel stages. For instance, strategies can be tailored to address top-of-funnel awareness, mid-funnel nurturing, or bottom-funnel conversions, allowing for a more structured approach to improving overall performance. However, industry-specific nuances can significantly influence how these advantages and disadvantages play out.
Industry-specific benchmarks highlight key differences. For example, chemical and pharmaceutical SaaS companies often see a 2.3% visitor-to-lead conversion rate and 47% lead-to-MQL conversions. In contrast, design SaaS companies might experience lower visitor-to-lead rates, around 0.9%, with a 40% lead-to-MQL conversion rate. These variations underscore how business models and target audiences impact funnel performance.
That said, over-reliance on benchmarks can be risky. Benchmarks may not fully account for a company’s unique circumstances, such as its target audience or business model differences. For instance, a cybersecurity SaaS company shouldn’t expect to achieve the same funnel metrics as a software provider focused on entertainment.
"The major problem with funnels is that they oversimplify the buyer's journey. Other major drawbacks include overlooking the multi-dimensional nature of social influence and failing to consider all the other marketing channels that prospects may interact with along the way."
Benchmarks can also limit flexibility. Rigidly adhering to industry standards might prevent companies from addressing the broader customer journey, both before and after the funnel. This narrow focus can lead to missed opportunities for enhancing the overall customer experience.
Data quality issues present another challenge. Extracting meaningful insights from benchmark data often requires advanced technical skills. Without proper expertise, businesses may misinterpret trends, leading to flawed optimization efforts.
| Aspect | Advantages | Disadvantages |
|---|---|---|
| Performance Assessment | Establishes a baseline for effectiveness | May not align with unique company circumstances |
| Resource Allocation | Helps prioritize key areas for improvement | Can overly focus on metrics, ignoring other factors |
| Industry Comparison | Highlights competitive positioning | Oversimplifies the buyer’s complex journey |
| Goal Setting | Provides realistic performance targets | May stifle ambition for bigger growth opportunities |
| Problem Identification | Pinpoints funnel drop-off stages | Overlooks multi-channel customer interactions |
The advantages also vary depending on the funnel stage. For example, top-of-funnel benchmarks can help identify awareness challenges that differ between businesses, such as a luxury fashion brand versus a budget-friendly e-commerce store. Mid-funnel benchmarks are better suited for uncovering nurturing gaps, while bottom-funnel metrics focus on closing inefficiencies.
Another drawback is the complexity of proper analysis. Reliable insights require sophisticated tracking systems and analytical expertise. Without these, businesses risk basing decisions on incomplete or inaccurate data.
Finally, customer experience should remain a priority. While improving conversion rates is beneficial, overly aggressive tactics aimed at meeting benchmarks can harm long-term relationships. Businesses should focus on creating a positive, holistic customer journey rather than chasing numbers alone.
Conclusion
B2B funnel drop-off benchmarks offer a valuable starting point for businesses aiming to improve their marketing performance. By leveraging these benchmarks, you can identify weak spots in your funnel and make targeted improvements.
Think of these benchmarks as a compass, not a strict rulebook. They help you focus on the stages that need attention while leaving room to adapt to your specific industry and company size. For instance, SaaS companies often excel in demo sign-ups, while manufacturing businesses tend to see stronger close rates.
As mentioned earlier, having the right tools can turn data into actionable insights. The Marketing Funnels Directory provides a curated selection of resources - tools, courses, and books - that are tailored to help businesses build and refine B2B marketing funnels. These resources are designed to support data-driven strategies across every stage of the funnel, from initial awareness to final conversion.
To see real results, focus on consistent improvement. Monitor user behavior, run A/B tests on critical elements, and analyze how different channels perform to ensure your budget is being spent wisely. Regularly reviewing metrics, like MQL-to-SQL conversion rates, will help you measure the success of your strategies and guide ongoing adjustments.
It’s important to view benchmarks as opportunities rather than limitations. For example, professional services boast the highest B2B conversion rates at 12.3%, while B2B tech averages just 1%. These variations reflect industry norms, not hard limits. Use this data to set achievable goals, address bottlenecks, and implement solutions that enhance your funnel’s performance.
FAQs
How can I find out which stage of my B2B funnel is losing the most prospects?
To figure out where prospects are leaving your B2B funnel, begin by outlining the entire customer journey and tracking how many leads move through each stage. Tools designed for funnel analysis can help you zero in on the stages where the biggest drop-offs happen. Common culprits often include a confusing user experience, unclear messaging, or expectations that don’t align with what’s being offered.
Pay close attention to metrics like conversion rates and engagement at each stage to spot trouble areas. Combining behavioral analysis with customer feedback can also reveal sticking points, giving you the insights needed to tweak and improve your funnel for smoother performance.
What are the best strategies to boost conversions at the awareness stage of a B2B funnel?
To boost conversions during the awareness stage of your B2B funnel, focus on strategies that draw in and connect with your ideal audience. Start by refining your SEO efforts to make sure your website ranks well for the search terms your potential leads are using. This ensures they can easily discover your business. Combine this with valuable content marketing - think blog posts, whitepapers, or videos - that not only informs but also positions your brand as a go-to resource.
Craft informative and engaging content that directly tackles the challenges or questions your audience is facing. By addressing their concerns, you build trust and lay the groundwork for guiding them further through the funnel. The goal is to deliver clear, actionable insights that grab attention and motivate them to engage more deeply with your brand.
Why are industry benchmarks important for optimizing B2B funnels, and how can they improve performance?
Industry benchmarks play a crucial role in fine-tuning B2B funnels by offering a clear reference point to measure your performance at every stage. Comparing your metrics to industry averages helps you identify exactly where potential customers are dropping off, so you can address those weak spots and make targeted improvements.
They also ensure your business stays competitive by aligning your strategies with what’s working across the industry. Plus, benchmarks help you allocate resources wisely, allowing you to focus on initiatives that boost conversion rates and improve overall efficiency. Using these insights can make your marketing funnel more effective and set the stage for sustained growth.


