More views do not mean better pipeline. If the wrong people watch your videos, your team can waste ad spend, SDR time, and follow-up effort.
Here’s the short version: I’d use YouTube demographics to check age, country, language, and returning viewers, then tie that data to UTMs, CRM records, demo requests, and SQLs. I’d also treat channel analytics and ad estimates as two different things. One shows what happened. The other shows what might happen.
At a glance, the article says to focus on:
- Audience fit over raw views
- U.S. market demand first, with local paths only when a market shows enough qualified conversions
- Returning viewers as a sign of mid-funnel interest
- Role and funnel stage over age alone
- Weekly, monthly, and quarterly checks to spot drift before it hurts pipeline
A few numbers stand out:
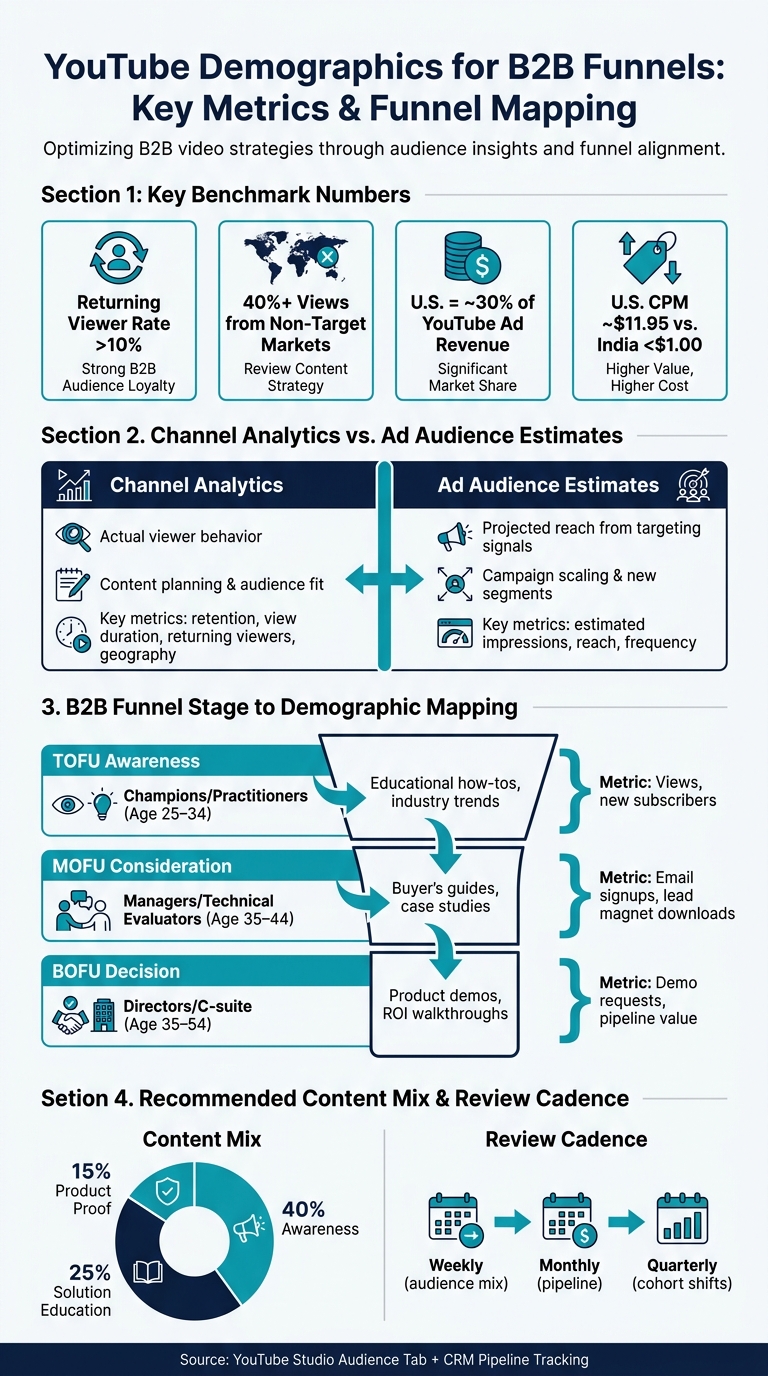
- A returning viewer rate above 10% can point to strong audience loyalty for B2B channels
- If 40%+ of views come from non-target markets, I’d review titles, thumbnails, and topic fit
- The U.S. drives about 30% of YouTube ad revenue
- U.S. CPMs can be around $11.95, versus under $1.00 in India
Here’s the main idea in plain English: use demographic data to decide who your videos should attract, what topics to cover, where to send viewers next, and which audience groups turn into pipeline.
That makes YouTube less of a traffic channel and more of a funnel input for your business.
YouTube Demographics for B2B Funnels: Key Metrics & Funnel Mapping
Read YouTube demographic data before planning content
Now it’s time to move from theory to the reports that tell you what’s going on. Start in YouTube Studio’s Audience tab. This is where you’ll find the viewer signals that matter most for B2B planning: age ranges, top countries, subtitle/CC languages, and viewer loyalty.
Use Audience reports to find age, geography, and viewer loyalty
In YouTube Studio, open Analytics from the left-hand menu and click the Audience tab. There, you can review age and gender breakdowns, top countries by watch time, subtitle/CC language preferences, and viewer loyalty groups: new, casual, regular, and returning viewers.
Of those signals, returning viewers deserve the closest look. A returning viewer rate above 10% is a strong sign of audience loyalty for B2B channels. In a long sales cycle, that often means someone is moving past early awareness and into active research. That’s the kind of behavior you want from a person helping shape a buying decision. Use those patterns to decide which topics deserve more coverage and which lead paths are worth optimizing for conversions.
You should also check the "Other channels your audience watches" module in the Audience tab. It can show whether your viewers lean toward hands-on technical tutorials or broader business content. That gives you a better sense of how deep or how broad your next video should be.
Separate channel analytics from ad audience estimates
Don’t mix up live channel data with ad forecasts. Channel analytics show what people actually did. Ad audience estimates show projected reach. One reflects behavior. The other is a forecast.
| Feature | Channel Analytics | Ad Audience Estimates |
|---|---|---|
| Data source | Actual viewer behavior | Projected reach from targeting signals |
| Primary use | Content planning and audience fit validation | Campaign scaling and reaching new segments |
| Key metrics | Retention, average view duration, returning viewers, geography | Estimated impressions, reach, frequency |
Here’s where B2B teams get tripped up: ad estimates can look big on paper while your actual watch time and CTR tell a much less exciting story. That gap matters. Before you put more money behind a segment, check whether the targeting lines up with what your channel data shows.
For example, if ad estimates suggest strong reach in a certain segment, but YouTube Studio shows low average view duration for that same geography or age group, your targeting is probably too broad. A smart next step is to link your YouTube channel to Google Ads so you can start lining up these data sets and move from projected reach to actual pipeline tracking. Use channel data first to check fit, then scale spend.
sbb-itb-a84ebc4
Use geography and language to shape top-of-funnel topics and lead paths
Use geography and language to pick topics and send viewers down the right funnel path. Start with the top countries and language settings you already see in your Audience tab. Those signals tell you where demand is coming from and how to guide each market.
Build awareness topics around U.S. market demand
The U.S. should be the base for your top-of-funnel content plan. It drives about 30% of all YouTube ad revenue and has CPMs around $11.95, versus less than $1.00 in India. If your goal is pipeline, that’s where to start.
For topics, lean into U.S.-specific problem-solving searches that buyers are already looking up. Think queries like "How much does a fractional CFO cost?" and "SOC 2 compliance". These aren’t idle searches. They usually come from people who are comparing options and trying to make a decision.
Use USD pricing in examples. If compliance comes up, refer to U.S. standards where it fits. That small detail helps the content feel made for the buyer instead of sounding generic.
After you’ve picked topics based on demand, line up the next funnel step with the right market and language.
Segment lead paths by market and language
Route viewers by both market and language. Use your language data to decide if one English-language path does the job or if a market needs its own landing page and nurture flow.
A simple rule works well here:
- Start with English by default
- Split into a local path only when a market shows enough qualified watch time and conversions
- Localize only when it leads to more qualified conversions
That keeps you from spending time on pages and email flows that look good on paper but don’t move leads.
Compare core and non-core geographies before spending more
Don’t judge a region by views alone. Watch time can look strong and still produce little business impact. What matters is conversion.
Use UTM parameters in your video descriptions so you can see which regions are booking demos and which ones are just watching. That gives you a cleaner read on market quality.
Scale a region only when it produces demos or SQLs, not just views.
Match audience fit to each stage of a long B2B funnel
After geography, look at who is watching. In B2B, that matters a lot more than raw view count.
Define the ideal viewer profile for buying committees
Most B2B deals involve three core roles: a champion, an evaluator, and a decision-maker. And each one is looking for different proof, a different level of detail, and a different kind of message.
Champions are often mid-level managers who lead research and make the internal case for change. Evaluators are usually technical staff or procurement teams that want demos, setup details, and proof that implementation will work in practice. Decision-makers are VPs and C-suite leaders who control budget and care most about ROI and business outcomes.
Age can help as a rough signal, but it shouldn’t lead the analysis. Job role matters more than age alone.
Map funnel stages to demographic segments and content types
If the wrong content shows up at the wrong time, the funnel slows down fast. Awareness content, for example, can leave decision-stage buyers stuck instead of moving forward.
A simple mix to use is 40% awareness, 25% solution education, and 15% product proof.
Then line up each role with the video format and CTA that fits where they are in the funnel.
| Funnel Stage | Demographic Segment | Content Type | Primary Success Metric |
|---|---|---|---|
| Awareness (TOFU) | Champions / Practitioners (Age 25–34) | Educational how-tos, industry trends, myth-busting | Views, new subscribers, brand reach |
| Consideration (MOFU) | Managers / Technical Evaluators (Age 35–44) | Buyer's guides, comparison frameworks, case studies | Email signups, lead magnet downloads |
| Decision (BOFU) | Directors / C-suite (Age 35–54) | Product demos, ROI walkthroughs, implementation plans | Demo requests, trial signups, pipeline value |
A good rule of thumb: don’t judge funnel fit by age brackets alone. A 32-year-old practitioner and a 32-year-old buyer can watch the same video for totally different reasons. That’s why role, stage, and intent need to work together.
Build a demographics-first measurement system and next steps
Track demographic cohorts from YouTube to pipeline
The next step is to connect audience signals to pipeline results. You’re not just trying to describe who watches. You want to confirm which viewers - champions, evaluators, and decision-makers - turn into MQLs, SQLs, and closed deals.
Start with unique UTM-tagged links in video descriptions and pinned comments so you can connect views to CRM outcomes. If those links flow into a CRM like HubSpot or Salesforce, you can track which viewer cohort - by age or geography - became a lead.
A common problem is cross-device conversion. Someone might watch on mobile, then convert later on desktop. When that happens, the UTM trail gets lost. One simple fix is to add a "How did you find us?" free-text field to booking forms. That gives you a way to catch leads your tracking misses.
Timing matters here too. Review audience mix every week, pipeline every month, and cohort shifts every quarter. That quarterly check is important because audience profiles often need 4–12 weeks to settle after a strategy change. If the wrong demographic starts gaining share - students instead of working professionals, for example - fix it early by changing thumbnail style and making metadata more specific.
Here’s a simple reporting setup that turns audience data into something your team can use:
| Metric | 30-Day View | Quarter-to-Date (QTD) | Year-to-Date (YTD) |
|---|---|---|---|
| Age Mix | % Primary Cohort (e.g., 35–44) | Trend vs. Previous Quarter | Annual Shift Analysis |
| Geo Mix | % Top Market (e.g., U.S.) | Regional Growth Rate | High-CPM Market Share |
| CTR (by Source) | Search vs. Browse CTR | Packaging Effectiveness | Long-term Brand Resonance |
| Lead Conv. Rate | Video-to-MQL % | Pipeline Velocity | Total Revenue Influence |
This kind of setup creates a feedback loop. Content gets a clearer signal on what to publish next, and sales gets a better sense of which leads deserve attention first.
Use curated funnel resources to improve execution
Once your tracking is set up, the next move is to close any tool or process gaps. The Marketing Funnels Directory is one place to look. It includes curated tools, vendors, courses, and books for B2B funnel execution.
The main idea from this guide is simple: audience fit drives pipeline quality. Pay attention to who is watching, not just how many people show up. Use geographic data to tailor content and lead paths. Expand into secondary markets when the numbers start pointing that way. Then line up your CTAs and follow-up sequences with those demographic signals, and judge performance by pipeline influence - not raw view count.
FAQs
How do I know if my YouTube audience fits my ideal buyers?
Compare your YouTube audience against your ideal customer profile using your top 20 revenue-generating accounts as the benchmark.
Look at who those accounts were when they first came in:
- Their pain points
- Their job titles
- The problems they were trying to solve
That gives you a much clearer picture than views or subscriber counts ever will. If your YouTube audience doesn’t line up with the people who turn into revenue, that gap matters.
Then shift your focus to intent and results.
Use Google Ads targeting signals to get in front of the right people. Build content around high-intent, problem-solving queries - the kinds of searches people make when they need an answer, not just when they’re browsing. And track what happens after the click.
Use UTM parameters to measure lead quality and conversions, not just views. A video with fewer views but better pipeline impact is doing more for the business than one that racks up traffic from the wrong audience.
When should I localize YouTube content for another country or language?
Localize when your demographic data points to a clear, steady group of viewers outside your main audience, like people in a certain country or city.
For trust and persuasion, translation alone usually isn’t enough. You also need to adjust the context, idioms, and pain points so the message feels natural to that audience. If your audience reports show a steady geographic cluster, start small with subtitles or localized metadata. Then, if the response keeps growing, move into dubbing or even dedicated channels.
What is the best way to connect YouTube viewers to demos and SQLs?
Use a full-funnel plan that lines up content and targeting with buyer intent.
For awareness, use educational videos. For consideration, lean on comparison content or tactical how-tos. For conversion, use product demos and case studies. On the direct-response side, put most of your ad spend in front of warm audiences, like website visitors, channel engagers, and CRM contacts.
Targeting should also match professional intent. Custom segments can help you reach people based on the topics they care about and the signals they show.
Then track every CTA with unique UTM parameters in video descriptions, pinned comments, and end screens. That way, demo requests and SQLs can flow straight into your CRM without guesswork.