Most visitors don’t scroll far enough to see your lead forms. This means missed opportunities to convert them into leads. Scroll depth, a metric tracking how far users scroll on a page, helps identify where engagement drops off. By analyzing this data, you can adjust your content layout, move CTAs higher, and improve conversions.
Key Insights:
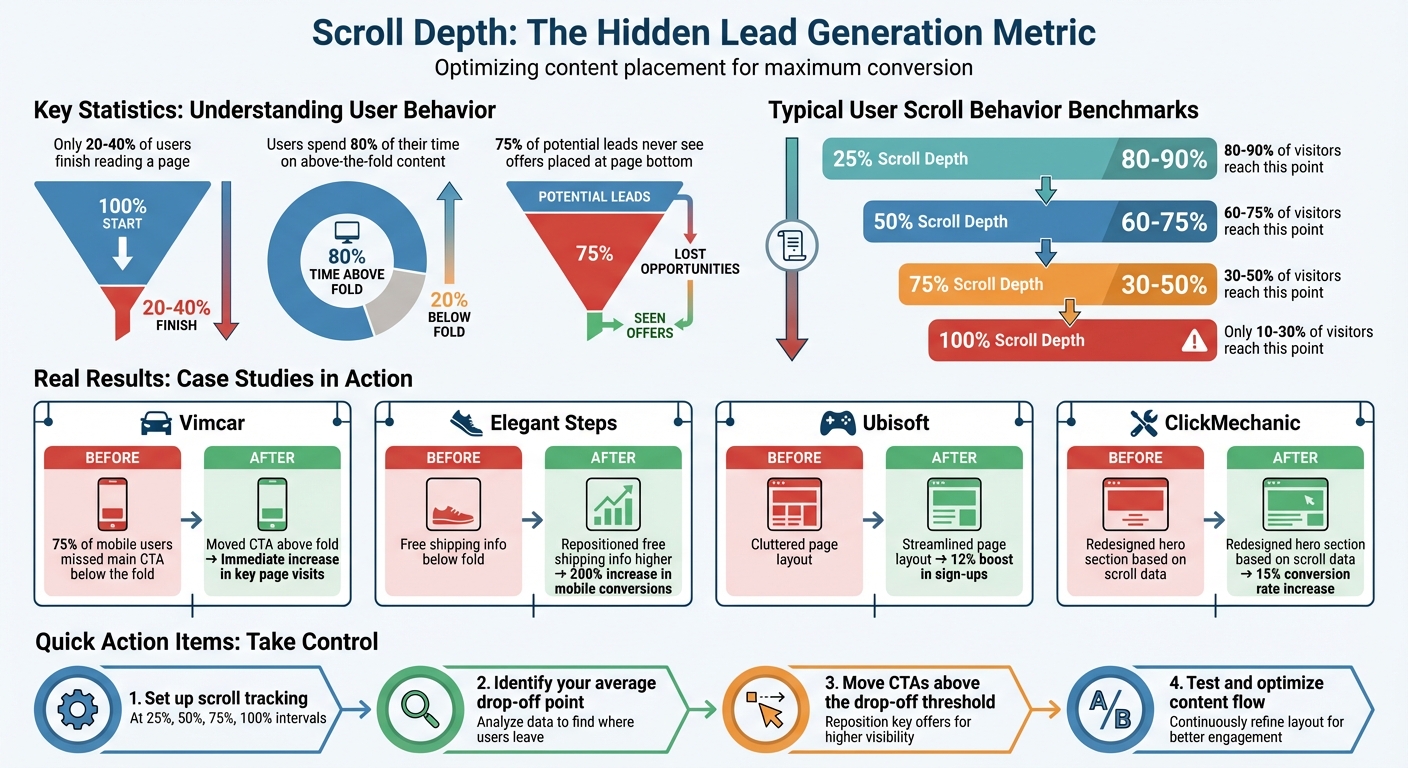
- Scroll Depth Basics: Tracks user engagement at points like 25%, 50%, 75%, and 100%.
- Common Drop-Off Points: Only 20–40% of users finish a page, leaving many CTAs unseen.
- Real-World Examples: Companies like Vimcar and Elegant Steps increased conversions by repositioning key elements based on scroll data.
- Actionable Steps: Use marketing funnel software and tools like Google Tag Manager (GTM) to track scroll depth, reposition CTAs above drop-off points, and improve content flow.
If your lead forms or CTAs are buried too far down the page, you’re likely losing conversions. Scroll depth data helps pinpoint where users lose interest so you can make impactful changes.
Scroll Depth Statistics and User Engagement Benchmarks for Lead Generation
What to Fix First on a Landing Page (Use Scroll Depth)
sbb-itb-a84ebc4
The Problem: Missing Leads Because Users Don't Scroll Far Enough
Many marketers assume that once a page loads, visitors naturally see all its content. But the reality is quite different. A significant portion of users stop scrolling early, meaning they never encounter your lead forms, calls-to-action (CTAs), or the persuasive content you worked so hard to craft. This unseen behavior can quietly sabotage your lead generation efforts. Tracking scroll depth is a practical way to identify and address this issue.
How Shallow Scrolling Hurts Lead Generation
When users don’t scroll beyond the first screen, they miss critical elements that drive conversions. For instance, if only 25% of visitors make it to the bottom of a page, that means 75% of potential leads never even see your offer. This disconnect can drastically impact conversion rates.
The "false bottom" effect makes things even worse. Design choices like large images or excessive white space can create the illusion that a page has ended prematurely. In 2025, Vimcar discovered that 75% of their mobile users weren’t seeing their primary CTA because it was placed below what appeared to be the page’s natural stopping point. Anna Grünanger, Head of Acquisition at Vimcar, shared:
"The scroll map showed that on mobile, 75% of users didn't see our main CTA. We moved it above the fold and saw an immediate increase in users landing on our key pages."
This example highlights how poor placement of essential elements can lead to missed opportunities.
Another factor is weak content hierarchy. If your most compelling offer or value proposition is buried halfway down the page, many visitors will lose interest before ever reaching it. Research shows that users spend 80% of their time focused on above-the-fold content, leaving lower sections largely ignored.
Scroll maps and conversion optimization can help uncover these problem areas.
Finding Where Users Lose Interest
Scroll depth data provides a clear picture of where your content fails to engage users. For example, a significant drop-off between 25% and 50% of the page often indicates that your introduction didn’t deliver on the promise of your headline. If users stop scrolling between 50% and 75%, it’s likely due to content fatigue - your material may be too lengthy, unfocused, or visually distracting. Identifying these drop-off points can guide you in refining your layout and content strategy.
In 2025, Elegant Steps, a shoe retailer based in the UK, used scroll maps to understand why their mobile conversions were underperforming. They discovered that key selling points, like free shipping, weren’t visible above the fold on mobile devices. After repositioning these elements where users could see them earlier, they achieved a 200% increase in mobile conversions. Similarly, Ubisoft Entertainment analyzed their "Buy Now" page and found that excessive vertical scrolling was discouraging users from completing purchases. By streamlining the page layout, they boosted sign-ups by 12%.
Low scroll depth combined with high bounce rates often points to irrelevant content or a poor user experience. Common culprits include slow load times, intrusive pop-ups, or long, unbroken blocks of text. These friction points create cognitive strain, prompting users to abandon the page before engaging further.
The Solution: Track and Analyze Scroll Depth
When users stop scrolling, they often stop engaging - and that means lost leads. To tackle this, you need to track exactly where users drop off. By identifying these points of disengagement, you can refine your content to guide users further down the path to conversion. Tools like GA4 and GTM are great for measuring engagement, and visual scroll maps can provide insights that raw numbers might not capture. Together, these methods help pinpoint where users lose interest and how to address it.
How to Set Up Scroll Depth Tracking
GA4’s Enhanced Measurement automatically tracks scrolling at 90% depth. But if you’re serious about lead generation, you’ll need more detailed insights - tracking at 25%, 50%, and 75% scroll points is key.
Here’s how to set this up in GTM:
- Use GTM’s built-in scroll variables.
- Create custom triggers for 25%, 50%, and 75% scroll depths.
- Link these triggers to event tags in GA4.
- Turn off GA4’s default scroll tracking to avoid duplicate data.
For dynamic pages, consider using pixel-based thresholds (e.g., 500px, 1,000px) to ensure consistency. Also, set conditions in GTM to fire scroll events only on pages longer than a specific height, such as 3,000 pixels. This prevents unnecessary triggers on shorter pages.
Visual scroll maps from platforms like Contentsquare or Hotjar can add another layer of insight. These heatmaps use color coding to show where users pause (warm colors) or leave (cool colors). They’re especially useful for spotting "false bottoms" - design elements that unintentionally signal the end of a page when there’s actually more content to explore.
Using Scroll Data to Improve Your Funnel
Once you’ve tracked scroll depth, it’s time to put that data to work. Look for patterns that reveal where your funnel is breaking down. For example, if users drop off significantly between 25% and 50%, your introduction might not be delivering on the promise of your headline. On the other hand, if engagement is strong up to 50% but conversions remain low, your CTA could be buried too far down the page.
To dig deeper, use GA4’s Explore tab to create a "Scroll Depth vs. Conversion" funnel. This will help you identify the scroll depth that most often leads to successful conversions. As Zander Aycock, Founder of Sharpen Marketing, puts it:
"If conversions are occurring primarily from users who only reach 50%, place CTAs higher on the page."
Combine scroll depth data with metrics like "Time on Page" to distinguish quick skimmers from deeply engaged readers. Break down your data by device type as well. Mobile users often scroll faster but may not engage as thoroughly as desktop users. If you notice a sharp drop-off between 50% and 75%, consider making your content easier to digest. Adding white space, shorter paragraphs, or visual elements can help combat content fatigue.
Resources from Marketing Funnels Directory

Tracking scroll depth is just one part of optimizing your marketing funnel. The Marketing Funnels Directory is a treasure trove of tools, courses, and resources to help you connect scroll depth insights with broader funnel strategies. Whether you need analytics tools, content optimization tips, or B2B funnel guides, this directory can help you turn data into actionable improvements for your lead generation efforts.
How to Increase Leads Using Scroll Depth Data
Move CTAs to Where Users Actually See Them
Scroll depth data can help you position your Call-to-Actions (CTAs) where they’re more likely to be noticed. For instance, if most users drop off around 30% of the page, placing your primary CTA or lead form slightly above that - say at the 20–25% mark - can significantly improve visibility and engagement.
"If a page experiences a 30% scroll depth on average, you'll likely want to place the CTA above that 30% dropoff point." - Nate Matherson, Co-founder & CEO, Positional
To take this further, compare scroll depth events (like scroll_to_25) with conversion events (like generate_lead). This will help you identify the scroll thresholds that correlate most with conversions. For example, if most leads are generated by users who only scroll halfway down the page, there’s no reason to bury your CTA further. On pages where scrolling behavior varies, sticky sidebars or header CTAs can ensure your offer remains visible.
Improve Content to Keep Users Scrolling
When users drop off between 10% and 25% of the page, it’s often a sign that your introduction isn’t grabbing their attention. Avoid generic or overly broad openings - address the user’s search intent right away. To keep readers engaged, break up dense text with subheadings, bullet points, or interactive elements like quizzes and infographics.
Also, watch out for oversized images or section breaks that might give users the impression the content has ended prematurely. Instead, use subtle animations, directional cues, or progress indicators to encourage readers to explore further.
These tweaks can make a noticeable difference in how far users scroll and, ultimately, how many convert using high-converting sales copy.
Case Study: How Scroll Data Improved Lead Page Performance
The impact of scroll data is clear when looking at real-world examples. Simon Tinsley, Growth Manager at ClickMechanic, used heatmap data to discover that most users weren’t scrolling past the hero section of their landing pages. By focusing on redesigning just that section, his team avoided unnecessary engineering work while boosting conversion rates by 15%.
Similarly, Vimcar used scroll maps to uncover that 75% of mobile users weren’t seeing their main CTA. By repositioning it above the fold, they immediately saw an increase in users reaching their key landing pages.
These examples show how small adjustments, guided by scroll data, can lead to measurable results.
Conclusion: Make Scroll Depth Part of Your Lead Strategy
Key Takeaways
Scroll depth tracking transforms vague engagement metrics into actionable insights that can directly influence your revenue. While pageviews tell you a page was loaded, scroll data confirms whether visitors actually saw your content. This isn't just about tracking numbers - it's about understanding what your audience sees and pinpointing where you're losing potential leads.
Data suggests that effective engagement patterns show 80–90% of visitors reaching the 25% scroll mark, 60–75% reaching 50%, and only 10–30% making it to the end of the page. If your conversion elements (like CTAs or forms) are buried below these thresholds, most of your audience may never see them. Moving these elements above common drop-off points could significantly improve your conversion rates.
Scroll depth also helps you identify false bottoms - design elements that make visitors think they've reached the end of the page - and distinguish between engaged readers and quick skimmers. Armed with this knowledge, you can fine-tune every section of your page to maximize its impact on lead generation.
Use this data to recalibrate your page layout and strategy.
What to Do Next
These insights offer clear, actionable steps to implement right away.
Start by setting up detailed scroll tracking at intervals like 25%, 50%, 75%, and 100% using Google Tag Manager. Compare these events to your conversion data, as GA4's default 90% threshold might miss critical drop-off points.
Based on this data, reposition lead forms, refine your introductions, and add visual cues to keep users engaged. Align these changes with your strategy to build a profitable online business using a sales funnel. If you're looking for additional tools and resources to build a stronger lead generation funnel, check out the Marketing Funnels Directory. It offers curated guides, courses, and tools to help you optimize every stage of your customer journey - from first interaction to final conversion.
Scroll depth isn't just a metric - it's a powerful diagnostic tool that shows whether your content and conversion strategies are working together effectively. Start tracking today, and you might be surprised by how many opportunities you're currently missing to capture leads.
FAQs
What scroll depth should I track?
To see how users interact with your content, track their scroll depth at key points: 25%, 50%, 75%, and 100%. These checkpoints reveal where visitors might drop off, giving you a chance to pinpoint and fix areas where engagement starts to fade.
How do I connect scroll depth to leads in GA4?
To link scroll depth with leads in GA4, you’ll need to set up scroll tracking as an event to measure how far users scroll on a page. By default, GA4’s enhanced measurement automatically tracks 90% scroll depth. However, if you want to monitor custom scroll thresholds, you can use Google Tag Manager or add custom code to your site.
Once set up, you can analyze scroll depth events in GA4 reports to pinpoint where user engagement drops off. This data can also help you draw connections between high scroll depth and conversions, like form submissions or purchases.
Where should I place my CTA based on scroll data?
When deciding where to place your CTA (Call-to-Action), aim for the sweet spot where users are most engaged - usually between 50% and 75% scroll depth. This is the range where interaction levels often peak, making it an ideal location to grab attention and encourage action. By positioning your CTA here, you increase its chances of being seen while minimizing the risk of users leaving before they encounter it.