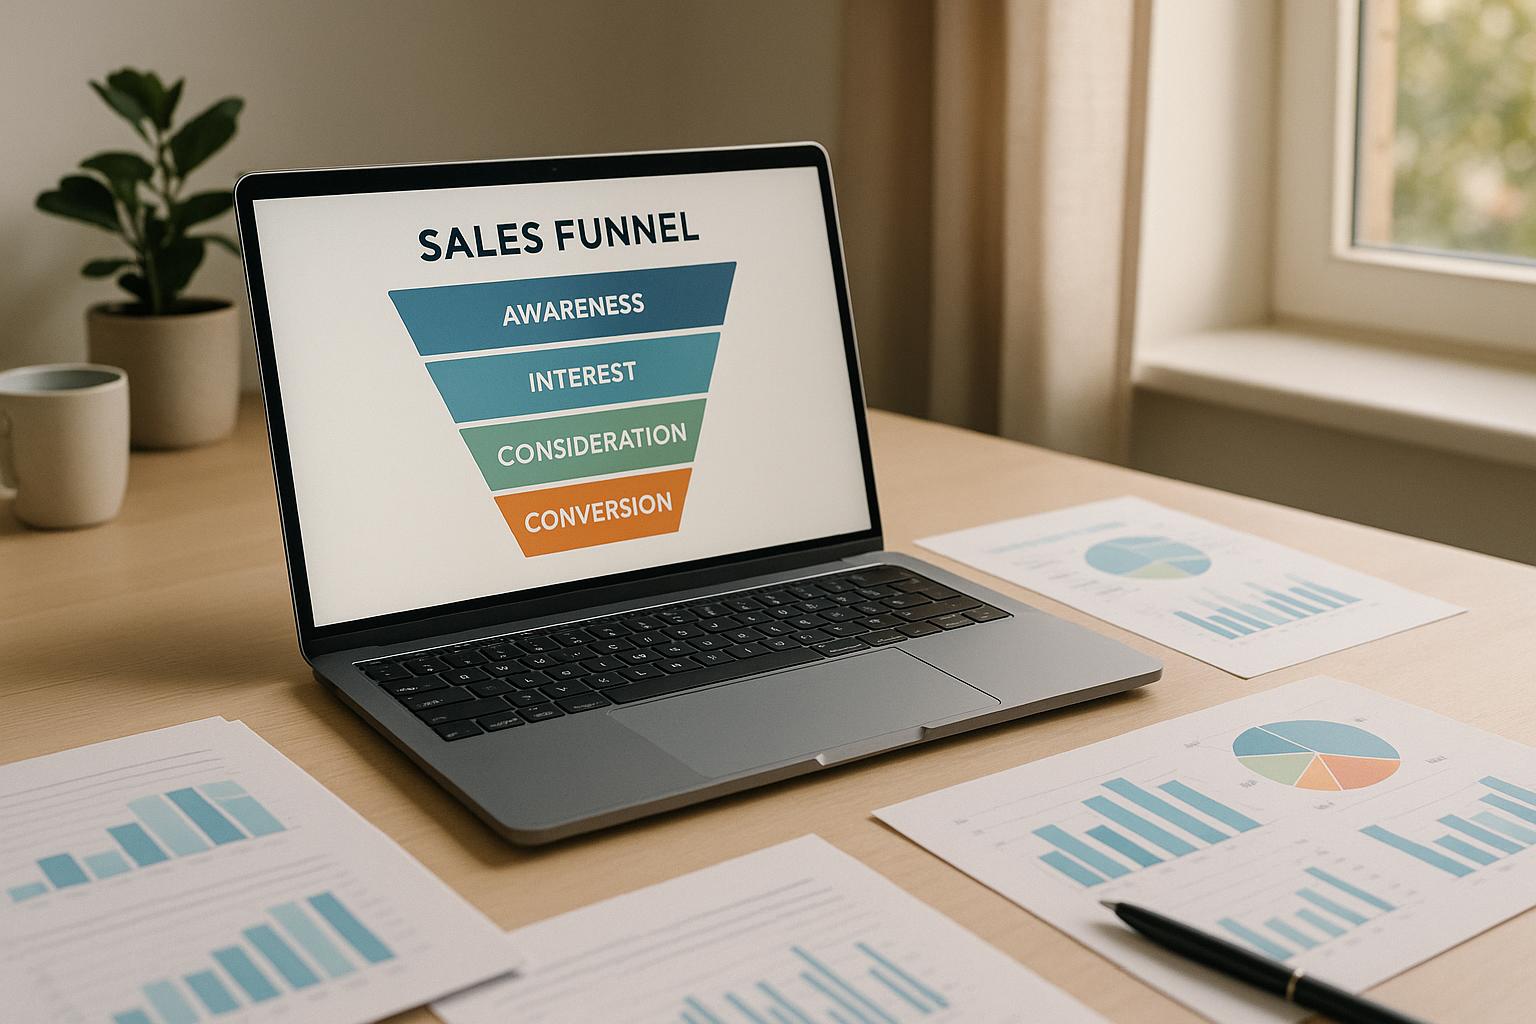
Sales funnel templates simplify how businesses visualize customer journeys, helping teams identify where leads drop off and improve conversions.
Here’s what you need to know:
- Why they matter: 68% of businesses lack a defined sales funnel strategy, leading to missed opportunities. Templates provide clarity by outlining each stage of the funnel and pinpointing problem areas.
- Types of templates: Options include spreadsheets for analysis, whiteboards for brainstorming, and presentation decks for reporting. You can also build high-converting sales funnels using specialized software platforms.
- Key features to look for: Compatibility with your data sources, clear visualization of metrics, and customization for your specific sales process.
- Popular tools: Salesflare offers manual tracking for B2B teams, while Coupler.io automates multi-source reporting. Creately and Miro excel in visual planning, and PowerPoint or infographic templates are ideal for presenting insights.
Whether you’re in SaaS, e-commerce, or consulting, these templates help align teams and improve decision-making. The right template depends on your goals, workflow, and sales cycle.
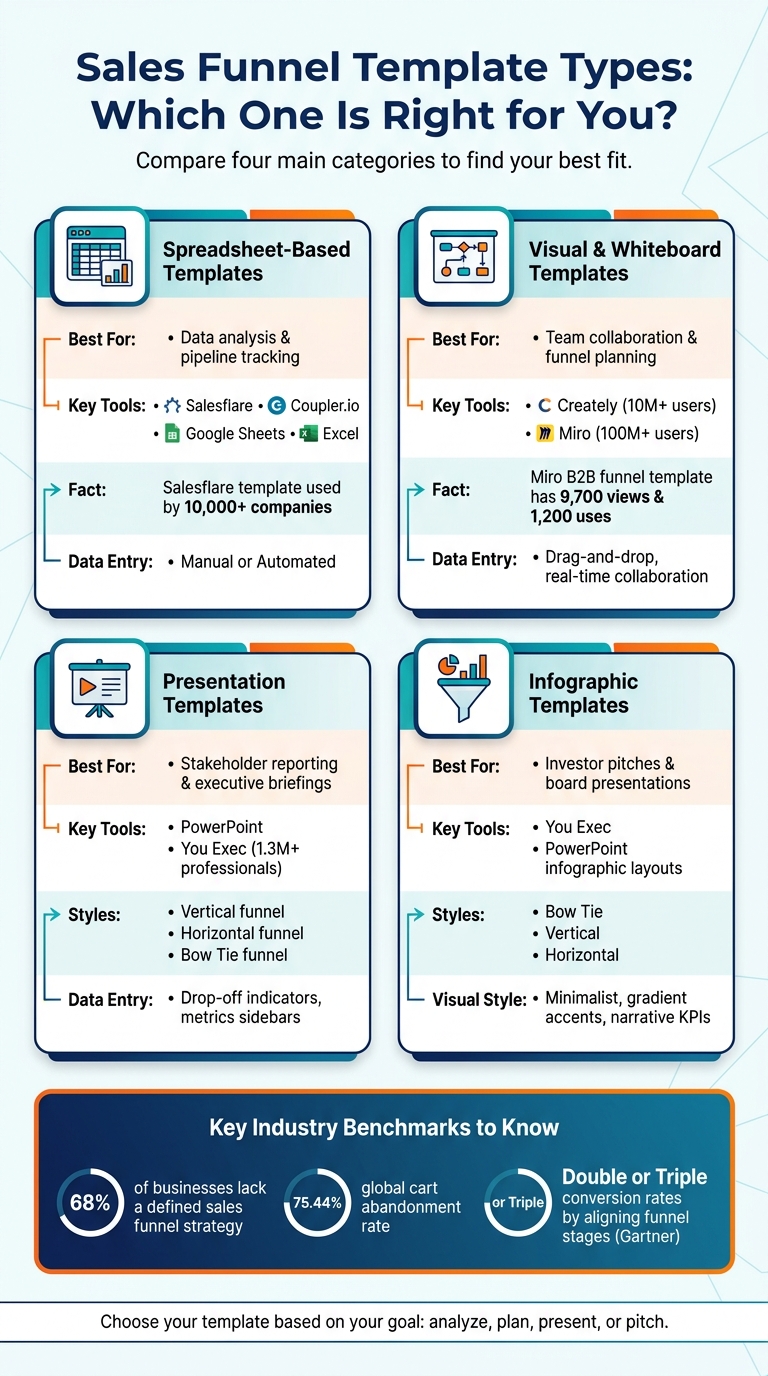
Sales Funnel Template Types: Which One Is Right for You?
Power BI Sales Funnel: Dashboard Tutorial with Template
sbb-itb-a84ebc4
How to Choose the Right Sales Funnel Template
Picking the right sales funnel template depends on factors like data source compatibility, the metrics it tracks, and how well it supports teamwork. Here’s a breakdown of what to consider to find a template that fits your team’s needs.
Data Source Compatibility
Start by checking how the template connects to your data. Does it require manual CSV uploads, API integrations (e.g., HubSpot, Salesforce), or third-party tools like Coupler.io? Compatibility with your platform is key. For instance, Looker Studio works well with Google-based data, while Power BI relies on .pbix files. If your campaigns span platforms like Google Ads and Meta Ads, look for a template that merges data into one view - this saves you from switching between multiple reports.
Another important factor is data refresh frequency. Templates that need frequent manual uploads can slow down your workflow. On the other hand, templates with live updates provide a more seamless experience, keeping your data current without extra effort.
Metric Coverage and Visualization Types
A solid sales funnel template should clearly show each stage of the funnel, including drop-off points, using both absolute numbers and conversion rates. For example, knowing exactly where a significant drop in volume occurs can be far more actionable than just seeing a high percentage loss.
Templates should also align with your industry. For SaaS, stages might include "Trial" and "Renewal"; for e-commerce, they could be "Product Views", "Add to Cart", and "Checkout"; for PPC, stages like Impressions, Clicks, and ROAS are essential. Beyond basic funnel diagrams, look for additional visuals like:
- Bar charts for comparing volumes
- Combo charts to track actual vs. target performance
- Time-based views such as Month-to-Date (MTD) or Year-over-Year (YOY) benchmarks
As Porter Metrics aptly states:
"A funnel dashboard exists to answer one question: where are you losing people?"
Finally, the ability to customize and collaborate is crucial for making the template work with your specific workflow.
Customization and Collaboration Features
A flexible template lets you rename funnel stages, adjust colors to match your brand, and apply filters for deeper analysis - whether by region, sales rep, or time period - without changing the core data.
Look for templates that support white-labeling and allow high-quality exports (e.g., PNG or SVG formats). Collaboration tools are equally important. Templates compatible with platforms like Google Sheets enable real-time edits, while Excel-based options allow shared access. Tools like Graphy even offer interactive embeds for enhanced teamwork.
Spreadsheet-Based Templates for Data Analysis
For teams working in Excel or Google Sheets, funnel templates offer a handy way to handle data analysis. These templates are straightforward, adaptable, and efficient, with options for both manual tracking and automated reporting. Below, we’ll explore two spreadsheet templates - one tailored for manual tracking and the other designed for automated, multi-source reporting.
Salesflare Sales Funnel Template
Salesflare provides a free template aimed at small B2B teams. It's built to simplify pipeline management by allowing you to track deal values (in USD), set expected closing dates, assign deals to sales reps, and schedule follow-up reminders. The best part? No complex formulas are needed. A dedicated "Insights" sheet does the heavy lifting, calculating revenue forecasts and conversion rates automatically.
Customization is easy. The "Settings & Instructions" sheet lets you define pipeline stages that align with your sales process. Whether your stages are Discovery, Proposal, Negotiation, or something else, you can tailor the template to fit. According to Salesflare, over 10,000 companies have adopted this tool to manage their pipelines. Matteo Mirabella, CEO of ResultConsulting, shared:
"Our revenue went x6 thanks to Salesflare through better follow up and new sales insights."
Coupler.io Automated Funnel Spreadsheets
If manual data entry feels like a bottleneck, Coupler.io offers a more automated solution. Their templates integrate directly with CRMs like HubSpot, Pipedrive, and Salesforce, as well as platforms like Google Ads, Facebook Ads, and GA4. This setup allows live data to flow directly into Google Sheets or Looker Studio dashboards.
The standout feature is multi-channel visibility. You can consolidate data from various sources - CRMs, GA4, and ad platforms - into a single view. This makes it possible to monitor the entire acquisition funnel, from ad impressions and clicks to closed deals. After an initial setup to configure connectors, the data refreshes automatically. The templates are free, and signing up for a Coupler.io account doesn’t require a credit card. For those seeking a more comprehensive platform, Systeme.io offers an all-in-one solution for building funnels and managing marketing workflows.
Both templates showcase how clear data visualization can speed up decision-making in managing sales funnels.
Here’s a side-by-side comparison of the key features:
| Feature | Salesflare Template | Coupler.io Templates |
|---|---|---|
| Data Entry | Manual | Automated via live connectors |
| Primary Sources | Custom deal data | HubSpot, Pipedrive, Salesforce, GA4, Ad platforms |
| Best For | Small B2B teams tracking deals in USD | Teams needing multi-source funnel reporting |
| Customization | Adjustable pipeline stages and follow-up days | Up to 5 funnel stages; filter by owner or label |
| Cost | Free | Free (free-tier account required) |
Visual and Whiteboard Templates for Funnel Planning
After diving into spreadsheet-based templates for data analysis, it's worth exploring visual and whiteboard options for a more dynamic approach to identifying funnel issues or adopting insight selling strategies. While spreadsheets are great for crunching numbers, visual and whiteboard templates help you map the customer journey, pinpoint friction points, and align your team - perfect for collaborative sessions involving sales, marketing, and product teams.
Creately Sales Funnel Template
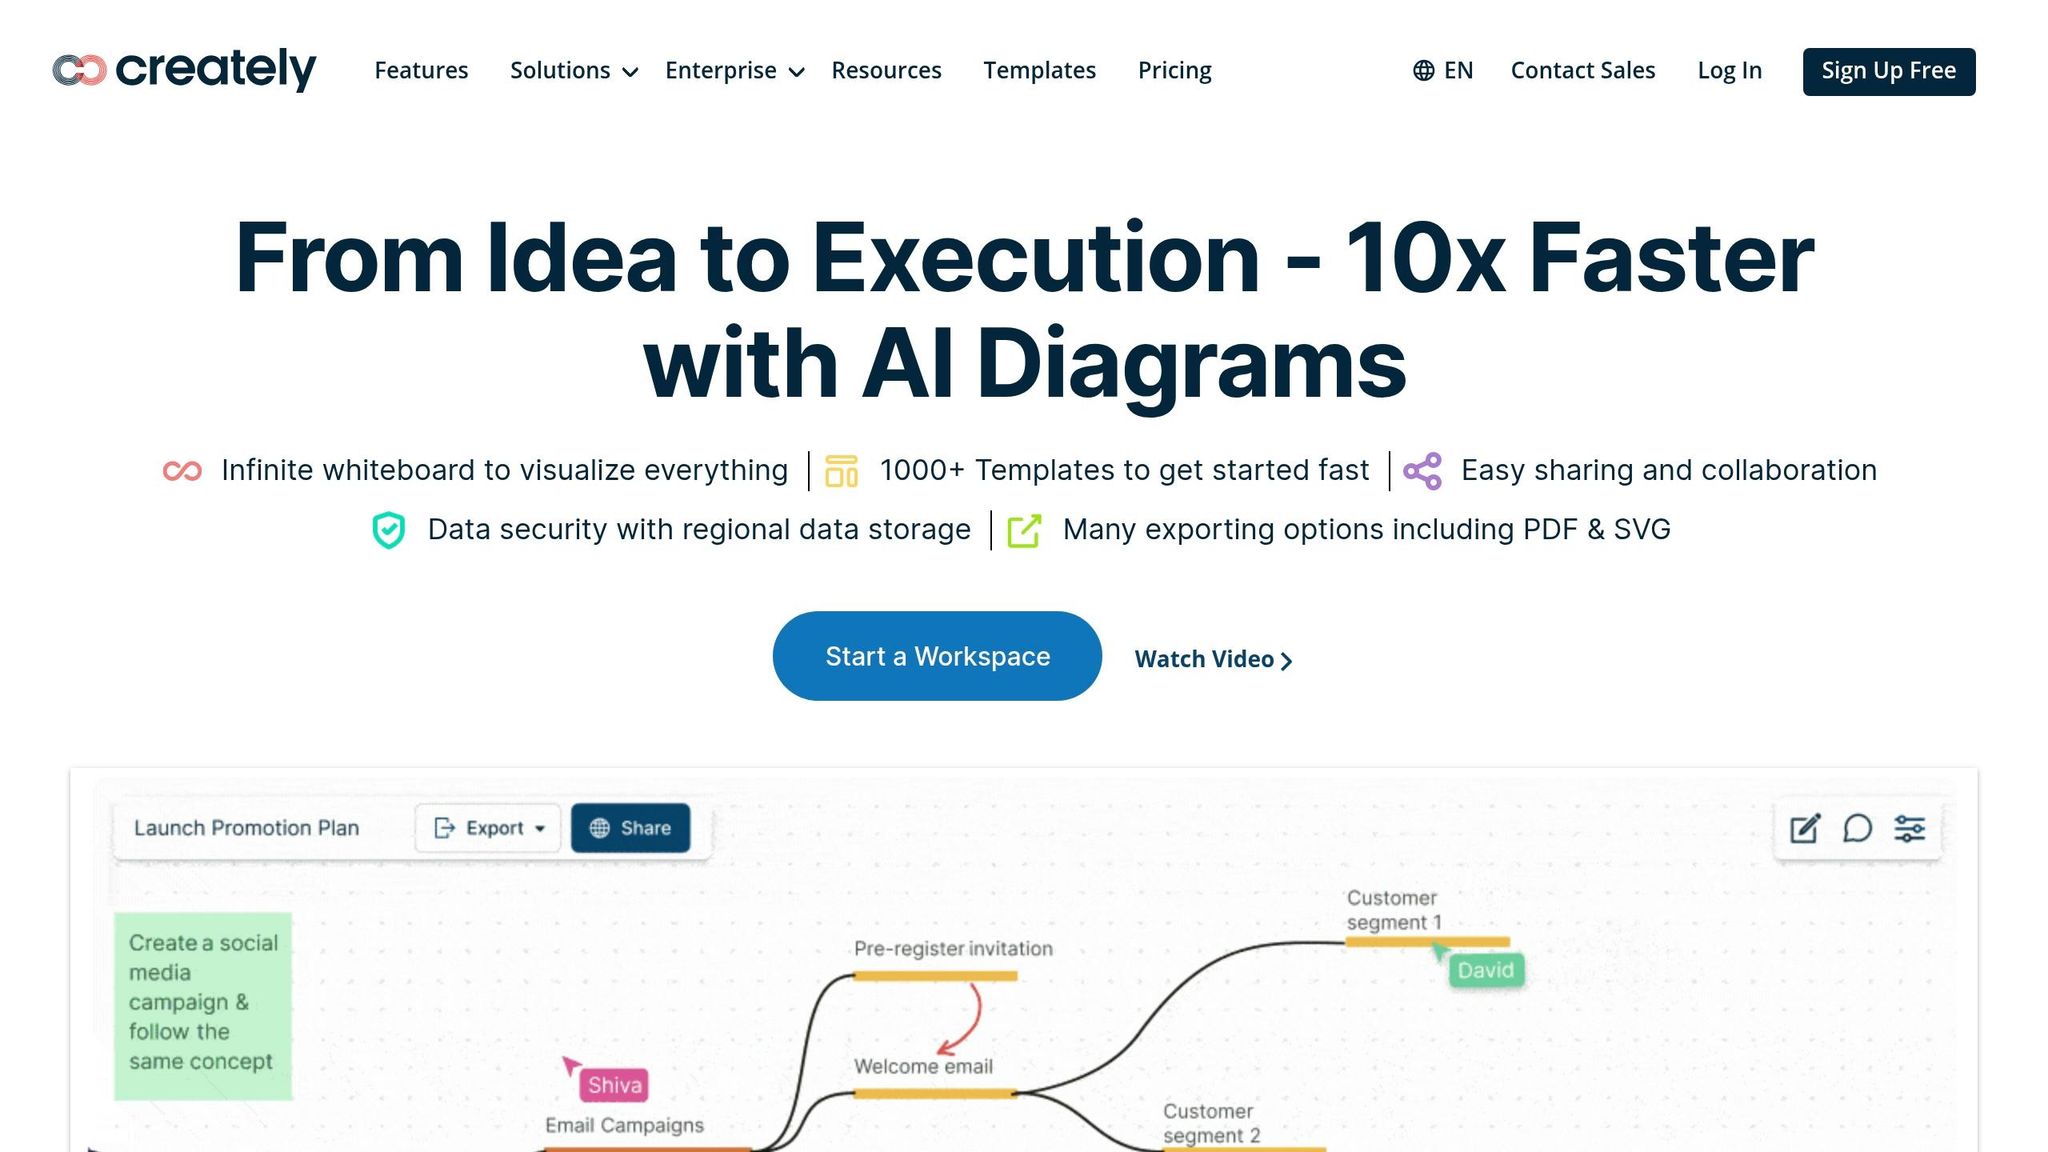
Creately, a diagramming platform with over 10 million users, offers sales funnel templates designed for visual collaboration. Using its drag-and-drop interface and dynamic connectors, you can easily map out even the most complex workflows. It integrates with tools like Google and CRM systems and allows you to create custom databases directly within the platform.
One standout feature is its infinite canvas, which supports thousands of elements. This means you can organize everything - customer personas, research notes, and funnel diagrams - all in one view. For remote teams, Creately includes real-time cursors, contextual commenting, and built-in video conferencing to keep everyone on the same page.
"A sales funnel represents your prospect's journey from their first interaction with your product/brand up until they complete a purchase." - Creately
Miro Marketing Funnel Templates
Miro, on the other hand, takes a slightly different approach, focusing on strategic alignment through visual modeling. With over 100 million users, Miro is often used in the early stages of planning, helping teams define funnel logic before diving into detailed data mapping. Its templates come with built-in frameworks for KPI tracking, forecasting, and outlining technical infrastructure, making them ideal for early strategy sessions.
The Miroverse community adds another layer of value, offering expert-created templates. For example, a B2B lead generation and sales funnel template in Miroverse has garnered 9,700 views and 1,200 uses, highlighting its popularity as a go-to resource for structured planning. If your team is launching a new campaign or defining a go-to-market strategy, Miro's templates provide a solid foundation to align everyone before execution.
These tools transform your funnel analysis into actionable plans, enabling seamless collaboration. Here's a quick comparison to help you decide which tool suits your needs:
| Feature | Creately | Miro |
|---|---|---|
| Primary Focus | Workflow mapping & data-linked diagrams | Visual modeling & team alignment |
| Collaboration | Real-time cursors, in-app video, async comments | Real-time co-creation, shareable links |
| Data Capabilities | Two-way sync with apps (Google/CRMs), custom databases | KPI structure and forecasting frameworks |
| Canvas Type | Infinite canvas (1,000s of items) | Expansive visual workspace |
| Export Formats | JPEG, SVG, PNG, PDF | PNG, JPG, PDF |
Presentation Templates for Funnel Reporting
Effectively presenting funnel performance is all about clarity and brevity. A well-structured visual can help stakeholders grasp key insights and act quickly.
PowerPoint Funnel Templates
PowerPoint funnel templates are tailored for diagnostic reporting. These templates often combine drop-off indicators, volume data, and conversion percentages into a single slide. By showing both the number of leads at each stage and the corresponding conversion rates, they provide a clear picture without requiring additional documentation.
To make your slides more impactful, use action-driven titles instead of generic ones. For instance, a title like "Checkout abandonment is costing $2M monthly - streamline payment flow to recover 40%" communicates both the problem's scale and a proposed solution right away. Templates with a metrics sidebar are especially helpful, as they highlight key performance indicators (KPIs) such as average deal size or sales velocity without overcrowding the main visual.
"The conversion funnel is the diagnostic x-ray of any growth operation. It shows where prospects enter, where they drop off, and how many make it through to become customers." - Deckary
By presenting data in terms of drop-offs, you can direct discussions toward areas where revenue is being lost. For a more visually engaging narrative, infographic templates are a great alternative, especially for executive-level presentations.
Funnel Infographic Templates for Executive Presentations
Infographic-style templates take a different approach. While PowerPoint templates focus on detailed analysis, infographic templates prioritize simplicity and storytelling. This makes them perfect for investor updates, board meetings, or strategic discussions where too much data on one slide can be overwhelming.
Providers like You Exec, trusted by over 1.3 million professionals from Fortune 500 companies and consultancies, offer over 20 specialized slide decks. These include unique funnel designs like bow tie funnels, which show the entire customer lifecycle - from acquisition on one side to retention and expansion on the other. This type of visualization highlights not just customer acquisition but also long-term value. Vertical funnels work well for traditional sales processes, while horizontal layouts are ideal for sequential, multi-team workflows.
| Template Style | Best For | Key Visual Elements |
|---|---|---|
| Reporting (PowerPoint) | Sales pipeline reviews, bottleneck analysis | Drop-off indicators, metrics sidebars, volume labels |
| Infographic | Investor pitches, executive strategy sessions | Minimalist design, gradient accents, narrative KPIs |
| Bow Tie Funnel | Full customer lifecycle reporting | Split acquisition/retention layout |
| Horizontal Funnel | Multi-team or project-based processes | Linear stage flow, sequential task tracking |
Finding More Funnel Tools and Resources
Once you've chosen a template format, the next step is discovering tools that can elevate your funnel strategy. The Marketing Funnels Directory is a valuable resource for U.S.-based businesses, offering a centralized collection of software, vendors, courses, and books. Instead of scrambling to piece together scattered resources, this directory provides everything you need to support your funnel strategy in one convenient place.
The directory caters to a wide range of needs. For example, B2B teams can find tools designed to identify anonymous website visitors, while e-commerce brands can explore platforms for behavior-driven email and SMS automation. Tools like Funnel Flows and MindMeister are also featured, helping teams visually map out their funnel strategies. For those looking to sharpen their skills, the Courses section includes training options like ClickFunnels Mastery or LinkedIn Learning's lead generation courses - ideal for lean marketing teams looking to fill knowledge gaps.
As Pol Cousineau, Founder of The Digital Navigator, explains:
"Where marketing funnels are all about your prospect's interactions with the brand's content, sales funnels are about the prospect's interactions with your people." - Pol Cousineau
To ensure your funnel is performing effectively, benchmark your results against industry standards. For instance, landing pages targeting cold traffic typically have a conversion rate of 2–5%. If your results fall short, your templates may be obscuring performance issues. Additionally, with the global cart abandonment rate hovering around 75.44%, tools for retargeting and data visualization become critical. Using these benchmarking insights and visualization tools can significantly strengthen your overall sales funnel strategy.
Conclusion: Picking the Right Sales Funnel Template for Your Business
The best sales funnel template is one that mirrors your actual sales process. For B2B teams dealing with long sales cycles and multiple decision-makers, a detailed, multi-stage template is key. These templates help track nurturing efforts over weeks or even months. On the other hand, B2C and e-commerce brands often benefit from simpler 3–4 stage templates designed for faster conversions. Tailoring the template to your sales cycle ensures every stage is clearly defined and actionable.
The format you choose matters just as much. Spreadsheets work well for in-depth analysis, whiteboard tools are perfect for brainstorming and planning, and clean, polished infographics are ideal for executive reporting. Each format serves a specific purpose, so pick the one that fits your workflow.
According to Gartner, aligning your funnel stages with shared buyer-journey insights can significantly boost conversion rates - sometimes doubling or even tripling them. This kind of alignment starts with selecting a template that includes clear stage definitions and smooth handover points between teams.
Before settling on a template, set a measurable goal to guide your decision. For example, you might aim to "increase Q3 pipeline conversion by 10%". This clarity helps narrow down your options and ensures the template you choose supports your objectives.
For more resources, check out the Marketing Funnels Directory. It’s packed with free sales funnel tools, software, courses, and books to help you whether you're new to funnel visualization or looking to refine your current approach. By aligning your template with your sales process and measurable goals, you'll equip your team with the insights they need to succeed.
FAQs
How do I pick the right funnel stages for my business?
It's crucial to design funnel stages that mirror your customers' buying journey rather than relying on a one-size-fits-all framework. Start by analyzing your business model, the length and complexity of your sales cycle, and how your buyers typically research and make decisions.
Whether you opt for a 5-stage or 6-stage funnel, the key is ensuring each stage reflects the real steps your prospects take to evaluate and choose a product or service. To make the funnel effective:
- Set clear entry and exit criteria for each stage. This helps track where prospects are and what actions move them forward.
- Align marketing and sales teams so both understand and agree on the funnel structure. Collaboration ensures a smoother transition between stages and better results.
By tailoring the funnel to your buyers' actual journey, you'll create a system that works for your business and resonates with your audience.
Should I use a spreadsheet, whiteboard, or slide deck template?
When deciding on the right tool, it all comes down to your goal:
- Spreadsheets are ideal for tracking and calculating lead data, conversion rates, and pipeline value. They excel at automatically updating metrics and handling numbers efficiently.
- Slide decks work best for presenting concepts or strategies to stakeholders. They’re great for storytelling and visual impact but lack automatic updates.
- If you need to manage data and visualization together, a dedicated CRM might be the better choice.
For more guidance, look into additional resources to refine and improve your funnel strategy.
How can I connect my CRM and ad data to a funnel template automatically?
To link CRM and ad data to a funnel template effortlessly, leverage platforms designed to integrate data from various sources, such as advertising accounts like Google Ads and CRMs like HubSpot. These tools simplify the process by automating data mapping and combining, ensuring real-time updates for key metrics like ad spend, conversions, and revenue. For more advanced configurations, you can use SQL modeling or API connectors to sync data directly into visualization templates, making updates smooth and efficient.