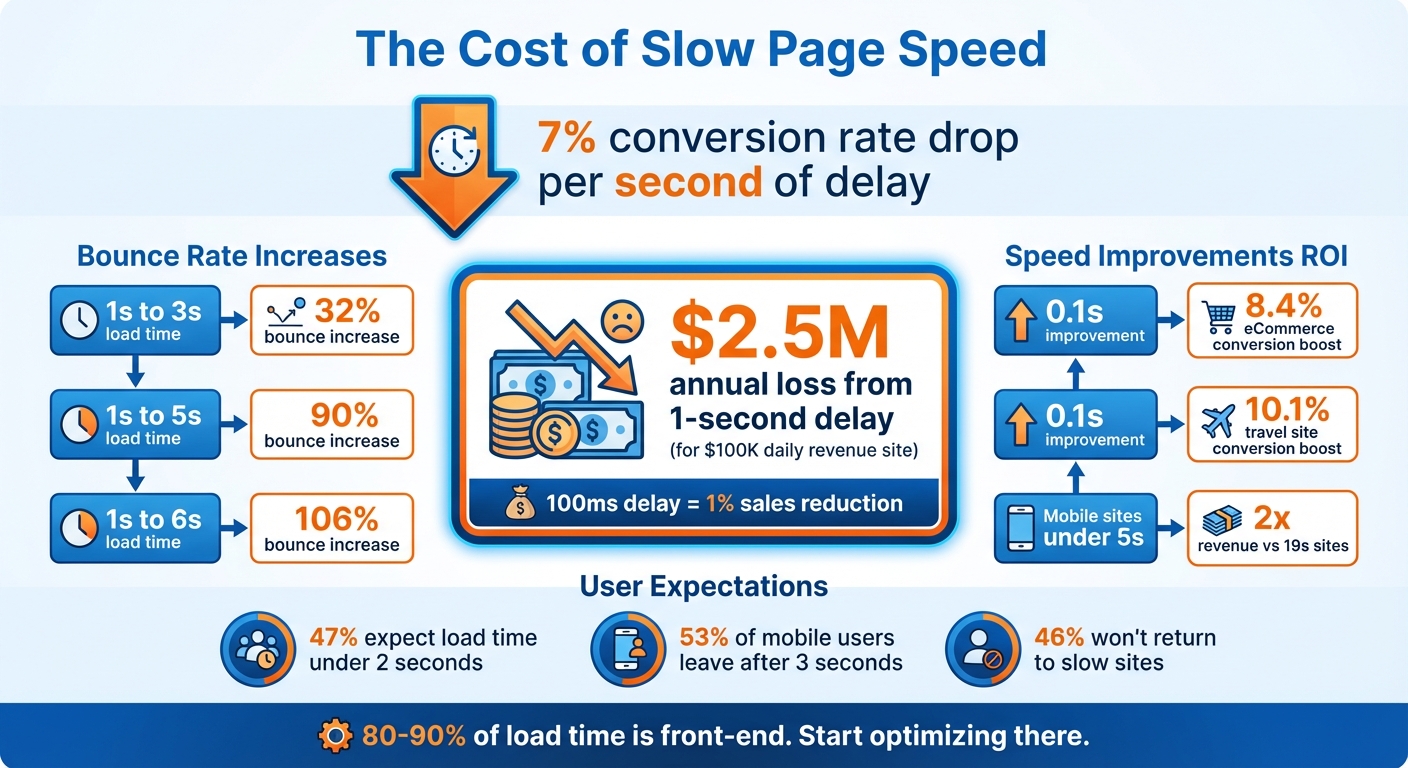
Slow websites cost money. Every second of delay in page load time can reduce your conversion rates by 7% and increase bounce rates by up to 106%. Speed directly affects how many visitors stay, engage, and ultimately purchase from your site. For example, a 1-second delay could cost an e-commerce site generating $100,000 daily up to $2.5 million annually.
Here’s why page speed matters:
- Faster sites convert better: A 0.1-second improvement can boost eCommerce conversions by 8.4% and travel site conversions by 10.1%.
- Slow sites lose users: 53% of mobile users leave if a page takes longer than 3 seconds to load.
- Revenue impact: Even a 100ms delay can reduce sales by 1%.
Key fixes to improve speed:
- Optimize images (use WebP or AVIF formats).
- Minify CSS, JavaScript, and HTML.
- Use caching and Content Delivery Networks (CDNs) to reduce load times.
- Focus on Core Web Vitals like LCP (under 2.5s), CLS (below 0.1), and INP (below 200ms).
Speed isn’t just a technical issue - it’s a direct factor in increasing revenue and customer satisfaction. Start optimizing today to keep users engaged and boost conversions.
How Page Load Time Affects Conversion Rates and Revenue
How Slow Page Speeds Hurt Conversion Rates
Data on Conversion Rate Loss
Page speed isn’t just a technical metric - it’s a business-critical factor. Every second of delay in loading time can seriously hurt your conversion rates. For each second of delay, conversion rates drop by 7%. Think about it: if your site takes 4 seconds to load instead of 1, you could lose 21% of potential conversions before visitors even engage with your content.
And it gets worse when you look at bounce rates. A load time increase from 1 second to 3 seconds causes bounce probability to shoot up by 32%. At 5 seconds, it jumps to 90%, and by 6 seconds, it skyrockets to 106%.
| Load Time Increase | Increase in Bounce Probability |
|---|---|
| 1s to 3s | 32% |
| 1s to 5s | 90% |
| 1s to 6s | 106% |
For B2B companies, the stakes are even higher. Sites loading in just 1 second see conversion rates close to 40%. But when that load time stretches to 3 seconds, conversion rates drop to 29%. Plus, 46% of users say they won’t return to a slow website, and 80% of those frustrated by slow speeds are less likely to buy from that business again.
The financial impact is just as alarming. A 2-second delay in page rendering results in an average 4% revenue loss per visitor. For large e-commerce platforms, even a 100-millisecond delay can lead to a 1% dip in sales. When you’re operating at scale, these small delays can quickly snowball into massive losses.
Business Losses from Slow Pages
The financial hit from slow pages can be staggering. For example, an e-commerce site generating $100,000 in daily revenue could lose $2.5 million annually from just a 1-second delay. Meanwhile, mobile sites loading in 5 seconds or less earn twice the revenue of those taking 19 seconds to load.
Real-world examples drive this point home. Take the Obama for America campaign in 2011. Kyle Rush, the lead engineer, cut page load times from 5 seconds to 2 seconds - a 3-second improvement. This seemingly small change led to a 14% increase in donations, adding up to an extra $34 million in contributions. That’s the power of speed directly impacting the bottom line.
"80-90% of the end-user response time is spent on the front-end. Start there." - Steve Souders, Head Performance Engineer, Google
Slow load times don’t just frustrate users - they cost businesses in revenue and customer loyalty. Delays cause a 16% drop in customer satisfaction, and the stress they create for users can have long-term effects on your brand.
Speed matters for engagement, too. Users experiencing load times of 3 seconds or less view 60% more pages than those on slower sites. When your site is slow, visitors don’t just leave - they never have the chance to explore your offerings, read your content, or move down your sales funnel.
sbb-itb-a84ebc4
Common Causes of Slow Page Speeds
Technical Issues That Slow Down Websites
When it comes to sluggish website performance, the culprit is often found on the front end - elements like images, code, and scripts that browsers need to process. Here's a striking fact: around 80–90% of the time it takes for a page to load is spent on the front end. This makes optimizing these components a key step toward faster load times.
Take images, for example. They can make up 50%–80% of a page's total weight. Many websites still use older formats like JPEG and PNG instead of modern alternatives like WebP or AVIF. These newer formats can shrink file sizes by up to 40%. Another common mistake? Loading oversized image files and then using CSS to scale them down, which forces users to download unnecessary data.
Other performance killers include render-blocking resources like CSS and JavaScript files, as well as bloated code packed with extra spaces or outdated comments. These inefficiencies delay the Largest Contentful Paint (LCP) and extend download times. On top of that, third-party scripts can pile on extra load, even if the server itself is running smoothly.
Speaking of servers, slow response times - measured as Time to First Byte (TTFB) - are often linked to poor hosting, sluggish database queries, or insufficient server resources. However, TTFB can see drastic improvement with effective caching, cutting response times from 3.68 seconds to just 415 milliseconds.
Fortunately, diagnosing these problems isn't guesswork. Tools like Google PageSpeed Insights and Lighthouse provide performance scores and identify specific issues like unused CSS or oversized images. For a deeper dive, tools like Pingdom or GTmetrix use waterfall charts to show which resources are taking the longest to load. If you're curious about how much CSS or JavaScript is actually being used, the Chrome DevTools Coverage Panel breaks it down for you.
While technical fixes are vital, they’re only part of the equation. User expectations are another driving force behind the demand for faster websites.
User Expectations for Fast Load Times
It’s not just about fixing the backend - meeting user expectations for speed is equally critical. And let’s be honest, today’s users are impatient.
Here are some eye-opening stats: 47% of users expect a site to load in 2 seconds or less, and 40% will abandon a site if it takes longer than 3 seconds. That’s a razor-thin margin for error when it comes to keeping your audience engaged.
The challenge becomes even steeper on mobile devices. In 2023, the average page load time was 2.5 seconds on desktop but a whopping 8.6 seconds on mobile. That makes mobile pages roughly 70.9% slower. Yet, mobile users still expect lightning-fast performance.
Why the disparity? Mobile devices generally have less processing power and memory than desktops, which makes them struggle with heavy code and large files - especially on slower 3G or 4G networks. And the frustration is real: research shows that delays on mobile websites can trigger stress levels similar to watching a horror movie.
First-time visitors face the worst delays since they don’t have a cached version of your site. This group, along with mobile users, is particularly sensitive to slow load times. A poor first impression can drive up bounce rates and hurt your site’s engagement metrics.
"Unfortunately, most mobile pages take much longer to load than their desktop counterparts, and mobile users expect pages to load much faster on their mobile devices."
In today’s world, meeting these speed expectations isn’t just about keeping users happy - it directly impacts your bottom line through better engagement and higher conversion rates.
How to Improve Page Speed and Increase Conversions
Optimizing Website Elements
To tackle slow page speeds, start by focusing on key website elements. Image optimization is a great first step. Transition from older formats like JPEG and PNG to modern ones like WebP or AVIF. These formats provide better compression without compromising image quality. Also, make sure to define width and height attributes for your images to avoid unexpected layout shifts. For images that are not immediately visible (below the fold), use lazy loading to ensure they load only when necessary.
Next, turn your attention to code optimization. Minifying CSS and JavaScript - essentially removing unnecessary spaces, comments, and characters - can shrink file sizes by as much as 50% to 60%. Combining multiple files into one further reduces HTTP requests, speeding up your site. Additionally, enabling Gzip compression can cut down the size of text-based resources by up to 60%.
Consider this: The Obama for America campaign managed to reduce page load time from 5 seconds to 2 seconds. The result? A 14% increase in donations, translating to an additional $34 million in contributions.
Caching is another crucial strategy. Implement both browser and server-side caching to avoid re-downloading identical data, potentially saving up to two seconds per load. For server performance, aim for a Time to First Byte (TTFB) of less than 800ms. This can be achieved by choosing reliable hosting and using effective caching techniques.
"Website speed isn't just a technical metric - it's a direct conversion factor." - Jeff Loquist, Senior Director of Optimization at SiteTuners
Using Advanced Tools and Techniques
Once you've covered the basics, advanced strategies can take your site’s performance to the next level. Content Delivery Networks (CDNs) are a powerful tool for this. By distributing static content across servers worldwide, CDNs minimize the physical distance between your site and its users, leading to faster load times. Despite their benefits, only about 33% of HTML document requests currently utilize CDNs, leaving plenty of room for improvement.
Another key focus should be Core Web Vitals, Google’s metrics for evaluating user experience. Aim for these targets:
- Largest Contentful Paint (LCP): 2.5 seconds or less
- Cumulative Layout Shift (CLS): under 0.1
- Interaction to Next Paint (INP): 200ms or less
To achieve these goals, prioritize above-the-fold images, define explicit dimensions for all images, and break up long JavaScript tasks to maintain responsiveness. For example, Vodafone improved its LCP by 31%, which led to an 8% boost in total sales.
Monitoring tools are also essential. Use lab tools like Lighthouse and field data sources like the Chrome User Experience Report (CrUX) to track performance. Focus your efforts on high-traffic, high-conversion pages by calculating a priority score: Priority Score = Monthly Traffic × Conversion Rate × Average Order Value × Expected Lift.
These advanced strategies work seamlessly with resources like the Marketing Funnels Directory to optimize your site’s performance and conversions.
Marketing Funnels Directory Resources for Optimization
If you’re looking for practical tools to implement these changes, the Marketing Funnels Directory is a great resource. It provides tools for site crawls that identify technical issues like render-blocking JavaScript and excessive redirects. You’ll also find resources for tracking Core Web Vitals using both lab and field data.
The directory focuses on solutions for front-end optimization, including image compression, code minification, and prioritizing resources. A faster website not only improves user experience but also keeps visitors engaged, helping them move smoothly through your marketing funnel - whether you’re running social media campaigns, content-driven funnels, or B2B lead generation efforts.
The ROI of Faster Page Speeds
Expected Results from Speed Improvements
Investing in faster page speeds brings clear financial benefits. For example, improving mobile site speed by just 0.1 seconds can lead to an 8.4% rise in conversion rates for eCommerce sites and a 10.1% increase for travel sites. On top of that, retail customers tend to spend 9.2% more when site speed sees a similar improvement.
The impact of speed optimization goes beyond these percentages. It can significantly affect revenue across industries. Take the case of a major UK health retailer in June 2019: they conducted an A/B test by adding a 1-second delay for half of their traffic. This small delay caused a 10.83% drop in purchase conversion rates, equating to a $13,000 daily revenue loss.
"The specific data and insights that this SiteSpect A/B test revealed gives us tremendous power to predict impact of any changes going forward." - Senior Digital UX & Product Manager
Even though professional page speed optimization might cost between $15,000 and $30,000, the potential annual revenue gains for a mid-sized site can surpass $400,000. This translates to ROIs ranging from 1,440% to 2,880%. For perspective, Amazon discovered that every 100 milliseconds of latency reduces their total sales by 1%.
Before and After: Page Speed Impact on Conversions
The relationship between page load times and conversions is undeniable. The table below highlights how revenue changes with different load times, based on 1,000 visits and a $50 average order value:
| Load Time | Average Conversion Rate | Revenue (1,000 visits @ $50 AOV) | Impact vs. 1-Second Load |
|---|---|---|---|
| 1 Second | 3.05% | $1,525 | Baseline |
| 2 Seconds | 1.68% | $840 | 45% Decrease |
| 3 Seconds | 1.12% | $560 | 63% Decrease |
| 5 Seconds | 0.67% | $335 | 78% Decrease |
These figures are backed by real-world examples. In 2021, Rakuten 24 enhanced its Core Web Vitals, leading to a 33.13% increase in conversion rates, a 53.37% boost in revenue per visitor, and a 35.12% drop in exit rates. Similarly, Vodafone improved its Largest Contentful Paint (LCP) by 31%, which helped drive an 8% increase in total sales.
Speed improvements also benefit every stage of the marketing funnel. For luxury brands, a 0.1-second speed improvement can result in a 40.1% increase in progression from product pages to the "Add to Basket" stage. Lead generation sites, on the other hand, may see a 21.6% rise in form submissions with the same enhancement.
Conclusion
Key Takeaways for Marketers and Business Owners
Page speed has a direct impact on revenue. Even a small improvement - like shaving off 0.1 seconds from load time - can increase eCommerce conversion rates by 8.4% and boost average order value by 9.2%. For B2B websites, the difference is even more striking: a 1-second load time can triple conversion rates compared to a 5-second load time.
One of the most pressing priorities is mobile optimization. Mobile pages, on average, take 70.9% longer to load than desktop pages. That’s a huge problem when 53% of mobile users will abandon a site if it takes more than 3 seconds to load. This gap between user expectations and actual performance creates a clear opportunity to make improvements.
To tackle this, focus on Core Web Vitals: aim for an LCP (Largest Contentful Paint) under 2.5 seconds, an INP (Interaction to Next Paint) below 200ms, and a CLS (Cumulative Layout Shift) score of 0.1 or less. By optimizing these metrics, you’re not just improving user experience - you’re also reinforcing the effectiveness of your marketing funnel. This is your chance to act now and make meaningful changes.
Next Steps for Improving Page Speed
Ready to take action? Here’s how to start improving your page speed right away.
Begin with a performance audit using tools like Google PageSpeed Insights or GTmetrix to see where you stand. For eCommerce sites, aim for load times between 1–2 seconds, and for lead generation pages, stay under 3 seconds.
Then, dive into front-end optimizations, which account for 80–90% of the time users spend waiting for a page to load. Some key steps include:
- Converting images to modern formats like WebP or AVIF.
- Using lazy loading for content that isn’t immediately visible.
- Minifying your HTML, CSS, and JavaScript files.
- Leveraging a Content Delivery Network (CDN) to reduce the physical distance between your server and your users.
Finally, explore resources like the Marketing Funnels Directory. This platform offers tools, vendors, and courses to help you implement these technical changes and refine your funnel strategy. From the first click to the final conversion, you’ll have the support you need to optimize every stage of the customer journey.
Free conversion rate optimisation course - Pagespeed Optimisaiton
FAQs
What page speed metrics should I focus on first?
To improve your website's performance and keep users happy, pay close attention to metrics like Largest Contentful Paint (LCP), Time to First Byte (TTFB), and overall render time. These measurements give you insights into how fast your pages load, which plays a big role in user experience and can influence conversion rates. Optimizing these areas is a smart move for better performance and happier visitors.
How fast should my site load on mobile to avoid losing buyers?
Your website needs to load on mobile devices in under 3 seconds if you want to keep buyers around. Here's why: 53% of mobile users will leave a page that takes longer than 3 seconds to load.
A slow-loading site isn't just frustrating - it directly impacts your bottom line. Faster load times can lead to better conversion rates, keeping your potential customers engaged and less likely to bounce. Think of it as the digital equivalent of a smooth in-store experience: no one wants to wait in line when they're ready to buy.
Which speed fixes usually increase conversions the most?
When it comes to boosting conversions, a faster website can make all the difference. Some of the best ways to improve site speed include:
- Compressing images: Large image files can slow down your site. By reducing their size without sacrificing quality, you can speed up load times.
- Reducing server response times: A quick server response ensures your site starts loading faster, keeping visitors from bouncing.
- Minimizing JavaScript and CSS files: Streamlining these files helps your site load more efficiently by cutting unnecessary code.
- Enabling browser caching: This allows returning visitors to load your site faster by storing parts of it on their device.
These tweaks not only improve load times but also keep users engaged, which can ultimately lead to higher conversion rates.