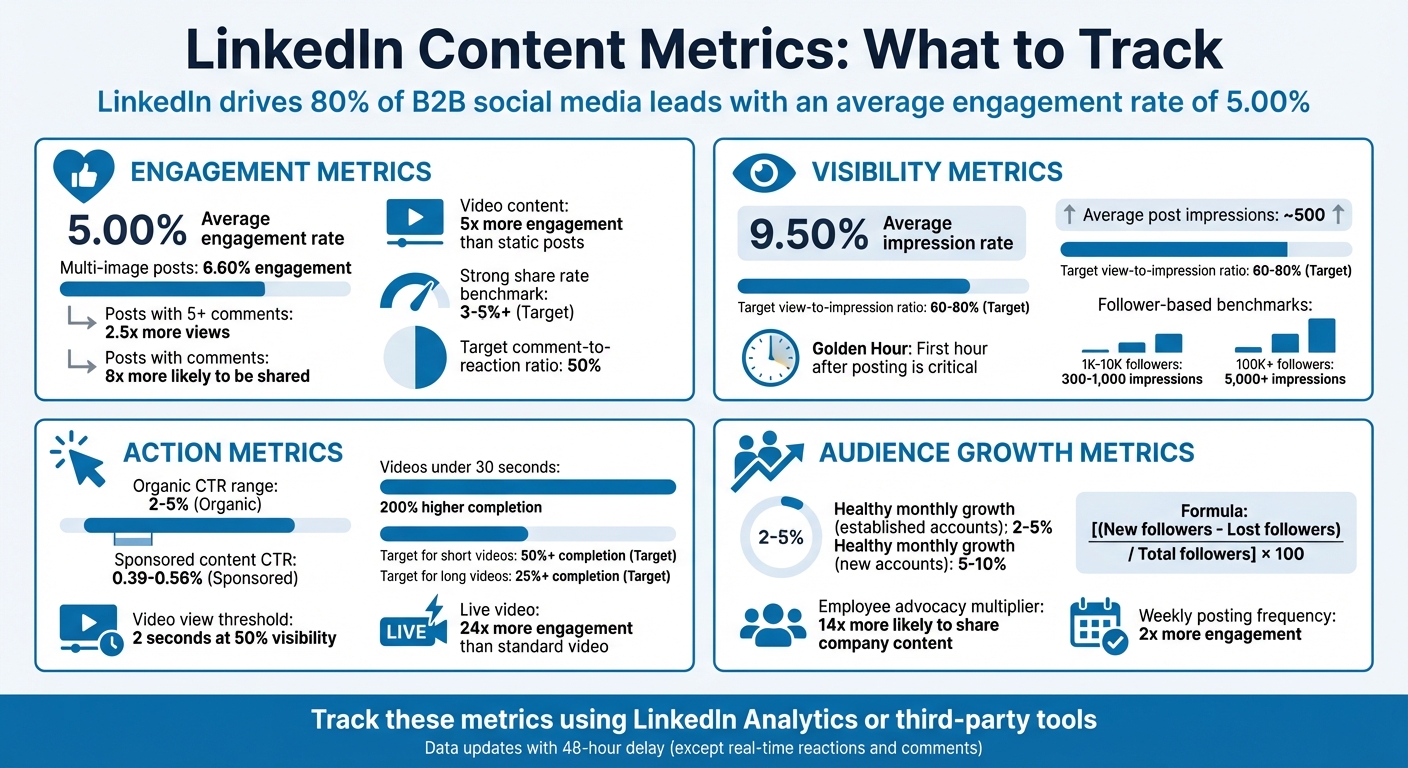
Tracking LinkedIn metrics is non-negotiable if you want to measure success and refine your strategy. With LinkedIn driving 80% of B2B social media leads and boasting an average engagement rate of 5.00%, understanding your performance data is key to staying competitive. Here’s a quick breakdown of the key metrics to monitor:
- Engagement Metrics: Likes, comments, shares, and engagement rate. Posts with more than five comments get 2.5x more views, and video posts generate 5x more engagement than static ones.
- Visibility Metrics: Impressions, unique reach, and profile views. The "Golden Hour" (first hour after posting) is critical for maximizing reach.
- Action Metrics: Clicks, click-through rates (CTR), and video completion rates. Organic CTRs typically range from 2% to 5%.
- Audience Growth: Follower growth rate, demographics, and new visitor data. A healthy monthly follower growth rate is 2–5% for established accounts.
Why it matters: Metrics offer actionable insights to fine-tune your content strategy, allocate resources effectively, and demonstrate ROI to stakeholders. Use LinkedIn Analytics or third-party tools like Socialinsider and Keyhole to dig deeper into trends and audience behavior.
Start tracking these metrics today to ensure your LinkedIn efforts are driving meaningful results.
LinkedIn Content Metrics: Essential KPIs and Benchmarks for B2B Marketers
Linkedin Analytics DEEP DIVE (tutorial for beginners!)
Engagement Metrics Checklist
Engagement metrics show how your audience interacts with your content. These figures help you understand if your posts are compelling enough to grab attention and inspire action. For context, the average engagement rate on LinkedIn is 5.00%, with multi-image posts performing the best at 6.60%.
Likes and Reactions
Likes and reactions are the first signs that your content struck a chord. When someone clicks "Like", "Celebrate", or "Insightful", they’re not just engaging - they’re signaling LinkedIn’s algorithm to extend your post’s reach. This extra reach pushes your content beyond your immediate network to second- and third-degree connections.
But it’s not just about the number of reactions. It’s equally important to analyze who is reacting. Use LinkedIn Analytics to identify the job titles, seniority levels, and industries of those engaging with your content. For example, if your goal is to reach C-level executives but your reactions are mostly from entry-level professionals, it’s time to rethink your strategy. Worth noting: companies that post at least once a week see twice the engagement of those that don’t, and video content generates five times more engagement than other formats.
After reviewing reactions, take a closer look at the depth of engagement by analyzing comments.
Comments
Comments are a strong indicator of whether your content is sparking meaningful conversations or simply being scrolled past. Posts with more than five comments get 2.5x more views, and those with comments are 8x more likely to be shared. LinkedIn’s algorithm rewards active comment sections by increasing the visibility of your post.
To gauge deeper engagement, track your comment-to-reaction ratio. A good benchmark is for comments to make up 50% of your total reactions - this shows your content is inspiring more than just surface-level approval. Also, timing matters. Responding to comments within two hours keeps the conversation alive and signals to LinkedIn that your post is driving active discussion.
Once you’ve analyzed comments, take note of how often your content is being shared.
Shares
Shares are the ultimate endorsement of your content. When someone shares your post, they’re essentially recommending it to their entire professional network. Posts with comments are 8x more likely to be shared, and LinkedIn users are 20x more likely to share video content than other types.
A share rate of 3% or higher is considered strong, while hitting 5% or more indicates outstanding performance. Shares expand your reach to new audiences beyond your current followers. Additionally, employee advocacy can amplify this effect - employees are 14x more likely to share content from their own company. To calculate your share rate, use this formula:
(Total Shares ÷ Total Impressions) × 100.
Visibility Metrics Checklist
Visibility metrics show how often your content appears in front of people and how many unique individuals actually see it. These insights help you gauge whether your posts are standing out in LinkedIn's crowded feed.
Impressions and Reach
Impressions count every time your content is displayed, while Reach (also called "Members Reached" or "Unique Impressions") measures the number of unique viewers who see it . Brendon Bosworth explains the difference clearly:
"Impressions = How many times your post was shown on someone's screen. Members reached = How many different people saw it (no repeats)".
For example, if one person scrolls past your post three times, it counts as three impressions but only one unique reach. On average, a LinkedIn post garners around 500 impressions. To ensure your content reaches a broad audience, aim for a view-to-impression ratio of 60–80%.
The first hour after posting - often called the "Golden Hour" - is critical. Engagement during this time signals LinkedIn's algorithm to expand your reach. Your follower count also plays a role in determining impressions:
- Accounts with 1,000–10,000 followers typically see 300–1,000 impressions per post.
- Accounts with 100,000+ followers can expect 5,000 or more impressions.
As of 2024, the average impression rate on LinkedIn is 9.50%. Beyond impressions and reach, profile views can offer a deeper look into your audience's interest.
Profile Views
Profile views track how many people clicked through to your personal or company page after seeing your post. These clicks show that your message resonated enough to prompt further curiosity .
Want to increase profile views? Make sure your profile is optimized with industry-specific keywords in your headline and About section. This can boost your "Search Appearances", which measures how often your profile shows up in LinkedIn search results .
Action-Oriented Metrics Checklist
Action-oriented metrics help you measure whether your content inspires actions - like clicking a link, watching a video, or visiting your website.
Clicks and Click-Through Rate (CTR)
Clicks reflect how engaged users are with your content, brand name, or logo. To calculate your Click-Through Rate (CTR), divide the number of clicks by the number of impressions, then multiply by 100.
LinkedIn expert Jane Deehan highlights the value of CTR:
"Clickthrough rate (CTR) is a measurement of how frequently you stop the scroll, and stopping the scroll usually comes down to presenting something your audience can't help but be curious about."
A higher CTR signals LinkedIn’s algorithm to expand your post’s reach. For reference, organic posts typically achieve CTRs between 2% and 5%, while sponsored content averages between 0.39% and 0.56%. One B2B SaaS company improved its CTR from 1.5% to 3.8% in just three months by using benefit-driven headlines and carousel formats, which led to a 153% jump in website traffic.
To improve your CTR, focus on creating clear calls-to-action, writing benefit-driven headlines, and experimenting with carousel formats. You can track clicks in the Content tab of LinkedIn Page Analytics.
Next, let’s dive into video metrics to better understand engagement.
Video Views
A video view on LinkedIn counts after two continuous seconds when at least 50% of the video is visible. To evaluate video performance, don’t just rely on view counts - track metrics like Completion Rate and Average Watch Time.
Videos on LinkedIn generate five times more engagement than text-only posts, and live-streaming video can drive 24 times the engagement of standard video content. Shorter videos, especially those under 30 seconds, have a 200% higher completion rate compared to longer ones. For optimal results, aim for a completion rate of at least 50% for shorter videos and 25% or higher for longer ones.
In Q2 2023, HubSpot increased the number of video posts by 40% and focused on quick, 15-second tutorial videos. This shift led to a 45% rise in video watch time, a 28% increase in product sign-ups, an engagement rate of 7.8%, and a 145% jump in comments.
To increase video engagement, always add captions since most LinkedIn users watch without sound. Also, make sure your key message appears in the first 5–10 seconds to minimize viewer drop-off. LinkedIn’s Video Analytics provides additional insights, such as audience job titles and locations, to help fine-tune your strategy.
sbb-itb-a84ebc4
Audience Growth Metrics Checklist
Tracking audience growth goes beyond just measuring engagement and visibility. It provides a clearer picture of the long-term impact of your LinkedIn strategy and highlights whether your audience is expanding over time.
Followers and Visitors
Your follower count is more than just a number - it reflects your audience size and potential reach. But don’t stop at the raw numbers. Pay attention to the growth rate, as it reveals the momentum of your efforts. For established LinkedIn accounts, a healthy monthly growth rate typically falls between 2% and 5%. If your account is newer, aim higher - around 5% to 10%.
Here’s how to calculate your growth rate:
[(New followers - Lost followers) / Total followers at the start of the period] × 100.
It’s also important to track where your new followers are coming from. Are they finding you organically, or are they the result of sponsored campaigns? This insight helps pinpoint which acquisition channels are working best.
In addition, keep an eye on page views (total visits, including repeat visits) and unique visitors (individual users). If you notice a lot of traffic but a low conversion rate to followers, it might mean your content is grabbing attention but isn’t compelling enough to earn a follow .
For example, in May 2025, personal branding expert Nicole Sifers gained over 1,000 followers from a single LinkedIn post. Her secret? A high-impact hook and a clear call-to-action tailored to her audience’s professional needs. That post generated over 1 million impressions.
To fine-tune your strategy, monitor daily audience growth patterns. Identify which posts caused spikes in followers and analyze what made them stand out. Then, take a closer look at who makes up your growing audience.
Demographic Data
Demographic data reveals who your followers are, breaking down details like job function, seniority level, industry, location, and company size. This information is invaluable for determining whether you’re connecting with your ideal audience or missing the mark.
For example, if you’re targeting senior decision-makers but notice your followers are mostly junior employees, it’s time to adjust your messaging. Focus on addressing strategic challenges that resonate with decision-makers.
Seniority data can also guide the tone and depth of your content. Senior executives tend to prefer high-level industry insights, while entry-level professionals are more likely to engage with practical, step-by-step guides.
Location data is another key factor. It helps you decide when to post for maximum visibility in specific regions and whether to create localized content tailored to high-density areas.
In 2025, Claire Mason used LinkedIn Analytics to refine her content strategy. By analyzing demographic data, she adjusted her messaging and posting schedule, leading to 18 new leads and a 46.1% increase in profile views.
Demographic insights are most effective when paired with context. Understanding who your audience is allows you to make targeted adjustments that improve engagement and conversions.
Lastly, check your Search Appearances to see which companies and job titles are finding your profile. If they don’t align with your target audience, update your profile keywords and content topics to better match your goals.
Performance Tracking with LinkedIn Analytics
You can access LinkedIn Analytics for both personal profiles and company pages through the Me dropdown and the Analytics tab. This tool lets you review key metrics like post impressions, follower growth, and demographic details.
Once you're in the analytics dashboard, you can customize your view to suit your specific tracking goals. Adjust the date range to analyze short-term performance (7–14 days) or take a longer-term look (90–365 days) with daily or cumulative metrics. Shorter time frames are great for testing new content formats, while longer periods help you identify seasonal trends and assess long-term audience growth. Keep in mind that most metrics have a 48-hour delay before they appear, although reactions and comments typically update in real-time.
For a deeper dive into individual posts, navigate to your Activity feed and select View Analytics on the post you want to analyze. If you need to keep a long-term record, use the Export function to download your data as an .XLSX file. Since LinkedIn only retains 12 months of historical data, exporting your analytics regularly ensures you always have access to past insights.
To integrate your analytics into your overall content strategy, focus on metrics that align with your specific objectives. For example:
- If brand awareness is your goal, focus on impressions and follower growth.
- For engagement, track your engagement rate (interactions divided by impressions) and monitor comments.
- If lead generation is a priority, keep an eye on Click-Through Rates (CTR) and Lead Gen Form completion rates.
As Alexandra Rynne, LinkedIn Ads' Content Strategy Lead, aptly states:
"Data is one of the most valuable resources a B2B marketer has. It is the key to uncovering insights into how well your campaigns - and your company - are performing".
Establish a regular schedule for reviewing your analytics. For example, check recent performance daily, key metrics weekly, and broader trends monthly or quarterly. While the LinkedIn mobile app provides analytics for the last 30 days, the desktop version offers more comprehensive functionality and longer time frames.
Using the Marketing Funnels Directory for LinkedIn Content Optimization
Once you've gotten the hang of LinkedIn analytics, the Marketing Funnels Directory can take your content strategy to the next level. This resource is packed with tools, courses, and strategies designed to address LinkedIn's 12-month data limit and its lack of in-depth competitive insights. It’s also a great way to explore how third-party platforms can bridge the gaps left by LinkedIn's native analytics.
The directory connects you to third-party tools that go beyond LinkedIn’s built-in features. For instance, Socialinsider offers AI-powered content analysis, while Taplio combines analytics with AI-driven content creation. Another standout is Keyhole, which tracks real-time trends by analyzing hashtag performance and sentiment, helping you identify what’s resonating right now.
These tools enable smarter, data-driven decisions that extend far beyond basic metrics. For example, in Q2 2023, HubSpot shifted its focus, increasing employee-generated content by 30% and video posts by 40%. This strategic move paid off, boosting their engagement rate to 7.8% and driving a 145% jump in comments. It’s a clear example of how leveraging external resources can supercharge your LinkedIn strategy.
The directory isn’t just about tools - it also helps you understand your competitive position. With LinkedIn generating 80% of B2B leads and averaging a 5.00% engagement rate, benchmarking your performance becomes much easier.
As Emma Faggoter, Social Media Coordinator at Slice, wisely points out:
"Numbers alone don't tell the full story – you need context to uncover real insights".
The Marketing Funnels Directory provides that much-needed context. It transforms raw LinkedIn data into actionable strategies, helping you achieve better engagement and meaningful business results.
Conclusion
Tracking the right metrics transforms marketing from guesswork into a precise, data-driven strategy. These numbers serve as your guide, highlighting what’s effective and where adjustments are needed. By carefully monitoring engagement, visibility, and action-based metrics, you create a feedback loop that reveals what truly connects with your audience.
Consider this: 80% of B2B leads from social media originate on LinkedIn. With the platform's average engagement rate climbing to 5.00% - a 30% increase year-over-year - it’s clear that understanding your metrics is essential to staying ahead. To stand out, focus on creating content supported by strong data.
Metrics also help you differentiate between passive visibility and active engagement. While impressions show how many people saw your post, comments and shares indicate who’s genuinely interacting with your content and forming a connection with your brand. Posts generating more than 5 comments get 2.5x more views, reinforcing the importance of meaningful interactions.
The real value lies in understanding who is engaging with your content, not just the numbers. Regularly reviewing audience demographics ensures you’re reaching decision-makers and your ideal customer profiles, rather than random viewers. Use LinkedIn’s Analytics dashboard to refine your strategy, focusing on what resonates most. By keeping a close eye on these metrics and adjusting your approach accordingly, you’ll be better equipped to master LinkedIn as a powerful marketing tool.
FAQs
What are the best ways to improve my LinkedIn engagement rate?
To boost your LinkedIn engagement, aim to post regularly - about 2–5 times a week, ideally on weekdays. Use attention-grabbing visuals, short videos (under 30 seconds), and captions that spark curiosity or interest. Encourage interaction by asking questions or inviting comments and shares.
Stay active with your audience by responding promptly to comments and messages. Keep an eye on your engagement metrics to see which types of content perform best, then tweak your posting schedule, topics, or headlines based on those insights. These small, steady adjustments can lead to noticeable improvements over time.
What does the 'Golden Hour' mean on LinkedIn, and why is it important?
The term 'Golden Hour' on LinkedIn refers to the crucial first hour after you publish a post. During this window, LinkedIn’s algorithm evaluates the engagement your content receives - likes, comments, shares, and more. This initial activity helps the platform decide how far and wide your post should be shown.
If your content gains traction during this period, it’s more likely to reach a larger audience, boosting both visibility and impact. To make the most of this opportunity, aim to post when your audience is most active. You can also spark interaction by asking thought-provoking questions or encouraging discussions in your post.
How can demographic insights enhance my LinkedIn content strategy?
Demographic insights - like age, job seniority, industry, and location - can be game-changers when it comes to refining your LinkedIn content strategy. These details help you tailor your posts to better connect with the professionals who are actively engaging with your content. For instance, if you notice a significant portion of your audience is mid-level managers in the tech industry, you might focus on creating content such as case studies or thought leadership pieces that address their specific challenges and interests.
LinkedIn analytics also let you compare demographic data to your overall audience, making it easier to spot areas where you might be falling short. Say you find that decision-makers in a certain field aren’t engaging with your content as much as you'd like. This insight can guide adjustments to your targeting, posting schedule, or even encourage you to promote specific posts to bridge that gap. Over time, pairing these insights with performance metrics like impressions and engagement rates allows you to fine-tune your strategy for even better outcomes.
For a more efficient way to align your LinkedIn content with your audience's unique traits, explore tools like those in the Marketing Funnels Directory. These resources can help ensure your efforts are guided by data, making it easier to strengthen connections with the right professionals.