Most B2B marketing budgets fail because of poor allocation, not size. Here's how to fix that.
- Start with Revenue Goals: Tie your budget to revenue targets using backward budgeting. For example, if you need $1M in revenue, calculate how many leads, SQLs, and MQLs are required to hit that goal by building high-converting sales funnels.
- Balance Short-Term vs. Long-Term: Only 5% of B2B buyers are ready to purchase now. Allocate resources to both immediate demand (BOFU/MOFU) and future growth (TOFU/brand-building).
- Use Historical Data: Focus on high-impact metrics like Marginal ROI, not vanity metrics. Include all costs (ads, salaries, tools) when evaluating channel performance.
- Distribute by Funnel Stage: Early-stage companies may spend 80–90% on demand capture, while mature ones might allocate 60% to brand-building.
- Benchmark and Test: Use the 70/20/10 rule - 70% for proven channels, 20% for new opportunities, 10% for experiments. Adjust quarterly based on performance.
Key takeaway: Regular reviews and proper allocation can boost ROI by 15–30% without increasing spend. Focus on aligning your budget to revenue, balancing funnel stages, and refining based on data.
B2B SaaS marketing budget planning & allocation guide
sbb-itb-a84ebc4
Step 1: Set Your Campaign Goals and Revenue Targets
To build an effective budget, start by tying it directly to your revenue targets and building funnels that support those goals. This method, known as backward budgeting, works by determining your revenue goal and then calculating how many opportunities, SQLs (sales-qualified leads), and MQLs (marketing-qualified leads) you need to hit that goal. This approach ensures your budget is aligned with your growth objectives.
For mid-market B2B companies focused on growth, marketing budgets usually fall between 8–12% of projected revenue. But the percentage itself isn’t the most critical factor - it’s how you allocate that budget between capturing immediate demand and setting the stage for future growth. Here’s why: according to the 95:5 rule, only 5% of B2B buyers are actively looking to make a purchase at any given time. If you pour all your resources into bottom-of-the-funnel tactics to convert that 5%, you risk running out of opportunities once they’re gone.
Match Budget Allocation to Funnel Stages
Your revenue goals should guide how you distribute your budget across different stages of the funnel. Early-stage companies often dedicate 80–90% of their budget to demand capture and only 10–20% to brand-building efforts. On the other hand, mature organizations tend to reverse this split, investing around 60% in brand-building and 40% in demand capture. This shift acknowledges a key reality: once you’ve tapped into immediate demand, long-term growth depends on making your brand known to buyers who aren’t yet in the market.
To ensure your goals are achievable, calculate your required pipeline coverage. Divide your marketing-attributed revenue target by your average deal size and close rate. If this calculation demands more leads than your total addressable market can provide, it’s time to adjust your targets. Use your own historical conversion data to validate these numbers rather than relying on industry averages.
Focus on High-Impact Goals
Structure your budget around three key areas that resonate with leadership: Brand (to create future demand), Demand (to build near-term pipeline), and Retention/Expansion (to grow existing customer relationships). This approach helps you justify your budget with revenue-focused metrics rather than marketing jargon.
"The biggest shift I see in marketing leaders who succeed at budget conversations versus those who struggle is simple: the ones who win come in with revenue math. The ones who lose come in with marketing math." – Jared Kwart, Partner, Foes Inc.
Frame your budget as an investment in customer acquisition, directly tied to metrics like pipeline coverage, customer acquisition cost, and marketing-attributed revenue. These numbers not only help secure budget approval but also provide a foundation for ongoing performance measurement. Once you’ve established these benchmarks, analyze past channel performance to fine-tune your spending strategy even further.
Step 2: Review Past Channel Performance
Taking a closer look at past channel performance helps ensure your marketing spend aligns with revenue goals. The key here is to focus on metrics that truly matter - those that tie directly to pipeline and revenue - rather than getting distracted by vanity metrics.
Which Metrics to Track
When calculating total channel investment, don’t just stop at ad spend. Include all associated costs like salaries, agency fees, software, and content production. Ignoring these costs can inflate your ROI by as much as 2–4x. For instance, if you spent $10,000 on LinkedIn ads but also paid $3,000 for design and $2,000 for marketing automation, your actual investment is $15,000 - not $10,000.
One of the most effective metrics to prioritize is Marginal ROI, which measures the revenue generated by the next dollar spent. Unlike Average ROI, which gives a broader view, Marginal ROI tells you if additional spending will drive more revenue or if you’ve already hit your limit. Companies that optimize based on Marginal ROI often see marketing ROI improvements of 15% to 30% without increasing their budgets.
For B2B campaigns, where sales cycles can stretch over months, it’s smart to use a 90-day to 12-month rolling window to match marketing spend with the revenue it eventually produces. A mid-market B2B SaaS company working with Marqeu learned this the hard way. Initially, their data showed a paid search ROI of 8:1. But after adopting a position-based revenue attribution model that accounted for the entire customer journey, they found the actual ROI was 3.2:1. Surprisingly, content marketing, previously dismissed as underperforming at 0.8:1, turned out to be their best channel with a 6.7:1 ROI.
Don’t just measure closed deals (macro-conversions). Micro-conversions, like email signups, white paper downloads, or demo requests, also have value. Assign a dollar value to these based on historical conversion rates. For example, if 10% of email signups convert into customers worth $5,000, each signup is worth roughly $500 in expected value.
Once you’ve identified the right metrics, consolidate your data to highlight your top-performing channels.
Find Your Best-Performing Channels
To get a clear picture, pull data from your CRM, marketing funnel software and tools, and ad platforms into one central system. This step is crucial - disparate systems can lead to discrepancies of 40–70%. Also, ensure consistent UTM tracking to avoid mislabeling conversions as direct traffic.
Compare channels using consistent outcomes, such as revenue contribution, customer acquisition cost (CAC), or pipeline generated. A 5:1 revenue-to-cost ratio (or 500% ROI) is a strong benchmark for most analysts. Here are some typical ROI benchmarks by channel:
| Channel | Typical ROI Benchmark | Natural Measurement Timeline |
|---|---|---|
| SEO / Organic | 5:1 to 12:1 | 90–180+ days |
| Paid Search | 2:1 to 4:1 | 30 days |
| Email Marketing | 36:1 | 7–14 days |
| Paid Social | 2:1 to 5:1 | 30–60 days |
Keep in mind the halo effect, where one channel influences another. For example, an industrial manufacturing company relying on first-click attribution was over-investing in content while underfunding performance marketing. After switching to a position-based attribution model, they discovered performance marketing drove 3.2x more pipeline than previously credited. This insight led to a 47% increase in qualified pipeline within two quarters.
"Content was the demand generation engine; paid search was just the final click." – Marqeu
To refine your strategy further, map each channel’s spend against its conversions to identify the saturation point. This is where extra investment stops yielding meaningful revenue gains. A sausage brand used Marketing Mix Modeling in 2024 to uncover seasonal over-investment in certain channels. By reallocating their budget to avoid diminishing returns, they doubled their ROI while working with a smaller overall budget. Identifying these saturation points ensures every dollar you spend contributes effectively to your multi-channel growth strategy.
Step 3: Divide Budgets by Funnel Stage
After reviewing past performance, the next step is to allocate your budget across TOFU, MOFU, and BOFU stages. The distribution depends heavily on your company's growth phase. For instance, early-stage businesses often direct 80–90% of their budget toward demand capture (MOFU and BOFU) to quickly establish credibility and close deals. In contrast, established companies may dedicate up to 60% of their budget to brand-building efforts (TOFU) to maintain their position in the market. This structured approach ensures every dollar invested contributes to your revenue pipeline.
This strategy aligns with the 95:5 Rule, which highlights that only 5% of buyers are actively shopping for solutions at any given time. As George Coudounaris, Co-founder of The B2B Playbook, puts it:
"If you only allocate budget to capture the 5% already shopping, you'll hit diminishing returns fast".
Instead of relying on arbitrary percentages, reverse-engineer your budget from your revenue goals. Start with your target revenue, calculate the number of closed deals required, and work backward to determine the necessary opportunities, SQLs, and MQLs based on historical conversion rates. This "funnel math" approach has been shown to improve alignment between spending and revenue outcomes by 30–40%.
A useful framework here is the 70/20/10 strategy: allocate 70% of your budget to proven channels (usually BOFU and MOFU tactics with consistent acquisition costs), 20% to promising new opportunities, and 10% to experimental ideas. For that experimental 10%, establish clear "kill criteria" - for example, cutting a TOFU channel if the cost per lead exceeds $600 after 90 days - to avoid wasting resources. Let’s break down how each funnel stage benefits from this structured allocation.
TOFU: Build Awareness and Drive Traffic
Top-of-funnel (TOFU) activities focus on engaging the 95% of buyers who aren’t yet in the market. Early-stage companies might allocate just 10–20% of their budget here, while more mature organizations could invest up to 60% to drive long-term demand. TOFU channels include paid social, SEO, content marketing, display ads, and organic social using tools like Buffer. Before scaling with paid efforts, it’s wise to validate your messaging organically.
Keep in mind that TOFU investments often take time to yield results - typically 90 to 180+ days for channels like SEO. Cutting back on TOFU spending too soon could lead to a future pipeline shortage.
A phased approach can help maximize TOFU impact. Start by investing in people to create content and strategy, then allocate funds to media for amplifying that content, and finally to technology for automating proven processes. For example, early-stage companies might spend 50–60% of their budget on people and agencies, 20–25% on media, and 10–15% on technology. As you grow, the emphasis can shift toward media spending.
MOFU: Engage and Nurture Leads
Middle-of-funnel (MOFU) tactics are all about nurturing prospects who’ve shown interest but aren’t ready to buy yet. A good rule of thumb is to allocate 30–40% of your budget to MOFU activities like email marketing, webinars, account-based marketing, retargeting ads, and nurture sequences.
For example, email marketing tools like GetResponse often deliver a 36:1 ROI within a 7–14 day period. Webinars and educational content can help prospects move closer to making a decision by addressing their specific challenges. However, keep in mind the "assist effect": MOFU channels may not get credit in last-click attribution models, even though they play a critical role in the buyer's journey. For instance, a prospect might attend a webinar but convert later through a paid search ad. Misattribution can undervalue these essential touchpoints.
Once leads are engaged through MOFU efforts, the focus shifts to converting them in the BOFU stage.
BOFU: Convert Prospects to Customers
Bottom-of-funnel (BOFU) strategies target the 5% of buyers actively evaluating solutions. Around 20–30% of your budget should go to BOFU channels like paid search, retargeting campaigns, sales enablement tools, demo requests, and personalized outreach.
BOFU channels often deliver quick and measurable returns. For instance, paid search can yield a 2:1 to 4:1 ROI within 30 days. However, over-investing in BOFU creates risks. Focusing too heavily on the 5% of in-market buyers can lead to audience saturation and rising acquisition costs, especially while competitors investing in TOFU continue building awareness among future buyers.
To strike the right balance, apply the unit economics override: scale any channel - regardless of funnel stage - if its customer acquisition cost (CAC), multiplied by three, is less than the customer lifetime value (LTV) and the payback period is under 12 months. Also, ensure BOFU channels meet minimum "floor spend" requirements. For example, platforms like Google Search typically need at least $5,000 per month to gather sufficient data for optimization. Spreading BOFU spend too thinly across channels can prevent any one channel from reaching the scale needed for meaningful results.
Step 4: Use Industry Benchmarks for Budget Distribution
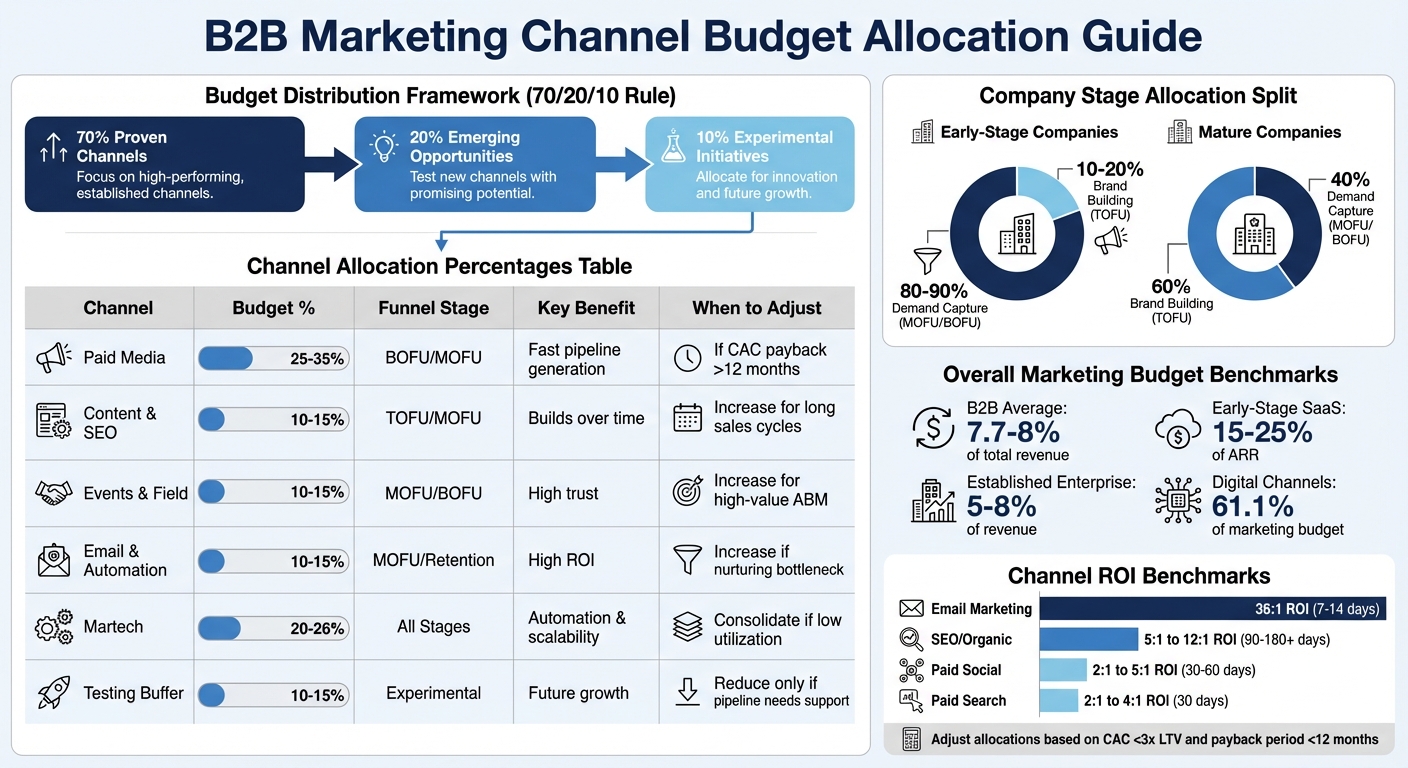
B2B Marketing Channel Budget Allocation Guide by Funnel Stage and Performance Metrics
Industry benchmarks can help guide your budget allocation by aligning with your goals and past performance. On average, most B2B companies dedicate 7.7% to 8% of their total revenue to marketing, with digital channels taking up 61.1% of that expenditure. Early-stage SaaS companies may allocate 15% to 25% (or more) of their annual recurring revenue (ARR) to marketing, while larger, more established enterprises typically spend 5% to 8% due to efficiencies gained from brand recognition.
A good starting point for budget distribution is the 70/20/10 rule: allocate 70% of your budget to proven channels, 20% to emerging opportunities, and 10% to experimental initiatives. This approach balances maintaining a steady pipeline with exploring growth and innovation. From there, you can refine channel-specific allocations based on these benchmarks.
Recommended Percentages for Each Channel
- Paid Media: Allocate 25% to 35% of your budget here, as it’s one of the quickest ways to generate pipeline growth.
- Content and SEO: Reserve 10% to 15%, though companies with longer sales cycles or complex products might need to allocate more.
- Events and Field Marketing: Dedicate 10% to 15%, especially for enterprise account-based marketing (ABM), where personal connections can be crucial.
- Email Marketing and Automation: Another 10% to 15% goes here, leveraging this owned channel for high ROI.
- Marketing Technology (Martech): Spend 20% to 26% on tools that enable automation, precise measurement, and scalability.
To ensure efficiency, audit your martech stack annually, removing underused tools and reallocating those funds to more impactful channels.
Reserve Budget for Testing and Opportunities
Keep 10% to 15% of your budget aside for experiments and unexpected opportunities. When testing, set clear hypotheses, define metrics for success, and establish criteria for decision-making. Each test should run for at least six weeks to achieve meaningful results. For example, Google Search campaigns typically require around $5,000 per month for proper optimization, while campaigns on Meta platforms may need about $3,000 per campaign. Whether a test succeeds or fails, document the outcomes - preventing a costly mistake can be just as valuable as finding a winning strategy.
Channel Comparison Table
| Channel | Allocation % | Funnel Stage | Advantages | Adjustment Triggers |
|---|---|---|---|---|
| Paid Media | 25–35% | BOFU / MOFU | Fast pipeline generation; scalable | Reduce if CAC payback exceeds 12 months |
| Content & SEO | 10–15% | TOFU / MOFU | Builds over time; reduces blended CAC | Increase for long sales cycles or complex products |
| Events & Field | 10–15% | MOFU / BOFU | High trust; strong enterprise conversions | Increase for high-value ABM initiatives |
| Email & Automation | 10–15% | MOFU / Retention | High ROI; full control over owned channel | Increase if lead nurturing is a bottleneck |
| Martech | 20–26% | All Stages | Supports automation and scalability | Consolidate if tool utilization is low |
| Testing Buffer | 10–15% | Experimental | Fuels future growth opportunities | Reduce only if core pipeline needs support |
Adjust your allocations based on your company’s maturity. Early-stage businesses often focus 80% to 90% of their budget on demand capture (MOFU and BOFU), while more mature organizations may allocate up to 60% to brand-building efforts (TOFU) to sustain their position in the market. Prioritize channels where the customer acquisition cost (CAC) multiplied by three is less than the customer lifetime value (LTV) and the payback period is under 12 months.
Step 5: Track Performance and Adjust Budgets Quarterly
Sticking to a fixed budget can lead to wasted spending. B2B sales cycles usually last anywhere from 3 to 18 months, so quarterly reviews strike the right balance. They give campaigns enough time to mature and deliver meaningful results without being thrown off by short-term fluctuations. Checking performance too often - weekly or even monthly - can lead to prematurely shutting down campaigns that are actually on track to drive revenue. By reviewing budgets quarterly, you can ensure spending aligns with revenue goals and shifts in market dynamics. To make these reviews effective, detailed attribution tracking is essential for identifying which channels are delivering results.
Use Multi-Touch Attribution to Track Results
On average, B2B buyers engage with 7 to 13 pieces of content before making a purchase. Add to that the fact that over 60% of online transactions involve multiple devices, and it’s clear that basic cookie-based tracking doesn’t cut it anymore. It fragments the buyer’s journey across devices, while person-level tracking consolidates data to show the true impact of each channel.
To get a complete picture, use parallel attribution models. Compare last-touch attribution (which credits only the final interaction) with models like U-shaped (giving 40% credit to the first and last touches) or W-shaped (assigning 30% credit each to the first touch, lead creation, and opportunity creation). The gap between these models can highlight channels that drive awareness but don’t get proper credit in standard reports. For businesses with high conversion volumes - 300+ per month - data-driven attribution can go even further, using machine learning to assign credit based on statistical contributions.
These insights are invaluable for fine-tuning your budget. Focus on marginal ROAS (return on each additional dollar spent) instead of average ROAS. A channel that delivered a 4x return two years ago might only return 1.2x today due to rising CPMs or audience saturation. Companies that consistently refine their channel mix often see marketing ROI improve by 15% to 30% without increasing overall spend.
Reduce Spending on Underperforming Channels
Once attribution models clarify each channel’s real impact, you can start adjusting budgets - but do it gradually. For channels that underperform, avoid drastic cuts. Instead, reduce spending by 10% to 15% increments, monitoring results before making bigger changes. Some channels may not directly drive conversions but contribute indirectly. For instance, social media might not close deals but could significantly boost branded search traffic.
Before pulling back on a channel, run incrementality tests - pause the channel or use geographic holdouts to confirm its actual impact. This helps determine whether the channel is driving sales or simply capturing buyers who would have converted anyway. Also, set minimum budget thresholds to maintain algorithmic efficiency. Keep seasonality in mind, too. For example, B2B Google Ads CPCs often spike in September and January due to budget planning cycles. Quarterly reviews help you account for these trends and ensure your budget is always working as hard as it can.
This ongoing review process ensures every channel delivers on its performance goals, keeping your marketing strategy sharp and effective.
Conclusion
Crafting a budget for B2B campaigns is not a one-and-done task - it’s an ongoing process that thrives on strategy and adaptability. Start by setting clear revenue goals and aligning your spending with the stages of your sales funnel. Lean on historical performance data to pinpoint the channels that offer the best marginal ROI. Whether your focus is on building awareness, nurturing leads, or converting prospects, allocate resources to the areas that deliver the most impact.
Industry benchmarks, like the 70/20/10 rule, can act as a helpful guide. This framework provides room for experimentation while safeguarding your core efforts. Setting aside 10–15% of your budget for testing allows you to explore new opportunities without jeopardizing proven strategies. And with 95% of B2B buyers not ready to make a purchase immediately, it’s crucial to strike a balance between capturing short-term demand and investing in long-term brand growth with The Ultimate Sales Machine framework.
The true edge comes from consistent evaluation and fine-tuning. Companies that conduct quarterly reviews and adjust their channel mix systematically often see a 15% to 30% boost in marketing ROI - without increasing their overall budget. By focusing on marginal ROI and making small, data-driven adjustments when performance dips, you can ensure your strategy remains effective.
Think of this as a dynamic approach to managing your multi-channel B2B funnel. As buyer behavior and market conditions shift, regular reviews and strategic reallocations will help you stay on track toward measurable growth.
For more insights and tools to refine your strategy, check out the Marketing Funnels Directory.
FAQs
How do I do backward budgeting from a revenue goal?
To create a budget based on a revenue goal, begin with your target revenue and work backward to calculate the necessary marketing spend. First, estimate the marginal ROAS (Return on Ad Spend) for each marketing channel. Then, divide your revenue goal by the ROAS for each channel to figure out how much to allocate. Be sure to account for any limits each channel might have. Keep an eye on performance, and adjust spending as needed to stay aligned with your goals. This approach helps you make the most of your resources while aiming for the best returns.
How should I split budget between TOFU, MOFU, and BOFU for my stage?
The best way to divide your budget across TOFU, MOFU, and BOFU depends on your specific goals and the market you're operating in. A widely-used method is to allocate:
- 50-60% to TOFU (Top of Funnel): Focused on building brand awareness and reaching a broader audience.
- 20-30% to MOFU (Middle of Funnel): Dedicated to nurturing leads and guiding them further along the buyer's journey.
- 10-20% to BOFU (Bottom of Funnel): Geared toward driving conversions and closing sales.
These percentages aren't set in stone. You should tweak them based on factors like how your audience responds, how well your channels perform, and the level of competition in your market. The key is to find the balance that delivers the best results for your campaigns.
How do I measure marginal ROI across channels with long sales cycles?
To measure marginal ROI in long sales cycles, focus on a data-driven strategy that tracks the added value from each dollar spent. Move beyond last-click attribution and adopt marketing mix modeling (MMM) to better capture cross-channel influences and long-term effects. Dive into performance data to spot diminishing returns and saturation thresholds. You can also leverage AI-powered tools to run simulations, helping fine-tune budget allocation and forecast revenue more effectively.