Low email engagement can push your messages out of the inbox - even when delivery stays at 98% or more.
If people ignore your emails, delete them fast, unsubscribe, or mark them as spam, mailbox providers read that as a warning sign. I’d focus on marketing funnel software and 3 things first: complaint rate, segment quality, and provider-level drops at Gmail, Yahoo, and Microsoft. Google says bulk senders should stay below 0.10% spam complaints and avoid 0.30% or more - about 3 complaints per 1,000 emails.
Here’s the short version:
- Delivery means the server accepted the message
- Deliverability means where it landed - inbox, spam, promotions, or quarantine
- Clicks, replies, complaints, unsubscribes, and bounces matter more than opens
- A drop at one provider often points to a local issue
- A drop everywhere usually means list, content, sending, or DNS trouble
- Recovery starts with active segments, clean suppression, one-click unsubscribe, and SPF, DKIM, DMARC checks
- I’d review results across several sends, not one campaign
If I were diagnosing a drop, I’d compare the last 4 to 8 weeks against an earlier stable period, split the data by provider, campaign type, and audience, then confirm the pattern with Postmaster tools, complaint data, bounce logs, and inbox tests.
Email Deliverability Tips To Reach the Inbox
For more ways to optimize your conversion paths, explore our marketing funnel resources to improve your overall strategy.
sbb-itb-a84ebc4
How Mailbox Providers Use Engagement to Judge Sender Reputation
Sender reputation is a rolling assessment, not a fixed score. Mailbox providers keep updating it based on engagement, complaints, bounces, authentication, content, and sending patterns. One campaign usually won't make or break you. But repeat patterns absolutely can.
Here's the basic loop: weak relevance often leads to more deletes, unsubscribes, and complaints. That can hurt reputation, which then lowers inbox placement. At the same time, low engagement is a signal, not hard proof. Poor targeting can cause it. So can send frequency, seasonality, or filtering.
How Gmail, Yahoo, and Microsoft Evaluate Sender Behavior Over Time
Mailbox providers don't all look at behavior the same way. That's why it's smarter to diagnose a drop at the provider level before you change your whole program.
Gmail looks at reputation across the IP, domain, and brand levels, and moving to a new IP or domain does not wipe the slate clean. New IPs start with little reputation, so they may have trouble until they build sending history. Yahoo puts weight on authenticated sending, low spam rates, and complaint handling. It also says senders should keep spam rates below 0.3%.
A drop at one provider doesn't automatically mean the whole email program is off track. If Gmail inbox placement falls while Yahoo and Microsoft stay steady, that's a clue to look at Gmail-specific issues first - maybe a recent jump in volume, complaint activity tied to that domain, or weak performance from a new sending domain.
If all three providers drop at the same time, the problem is probably broader. Common causes include poor list quality, an authentication failure, or a content shift that's driving complaints across the board.
Signal-by-Signal Interpretation Table
No single signal gives you the full picture. The table below works best as a diagnostic guide. It shows what each signal may mean for reputation and how to read the pattern without jumping to conclusions.
| Signal | Deliverability implication | Recommended interpretation |
|---|---|---|
| Clicks | Positive when genuine and consistent over time | Track click trends by campaign type; don't compare newsletter clicks with transactional clicks |
| Replies | Often a strong positive signal, especially for conversational mail | Separate genuine replies from automated responses and support traffic |
| Opens | Weak directional signal; privacy tools and automated scanners distort it | Use within the same provider and campaign type only |
| Deletes without reading | Repeated patterns may weaken engagement-based reputation | Look at subject lines, send frequency, and audience fit before drawing conclusions |
| Unsubscribes | High volume signals targeting or relevance problems | Honor requests promptly; use spikes as a cue to review segmentation |
| Spam complaints | One of the strongest negative reputation signals; can trigger filtering or throttling | Segment by provider, campaign, and acquisition source; act quickly on any increase |
| Hard bounces | Damages list quality and can compound reputation problems if left unaddressed | Suppress immediately and review how those addresses were collected |
| Soft bounces | Repeated failures may indicate throttling or a deeper infrastructure problem | Distinguish temporary limits from policy blocks and monitor retry outcomes |
Use these signals to figure out which provider, campaign, or segment is behind the drop.
How to Diagnose an Engagement-Related Deliverability Drop
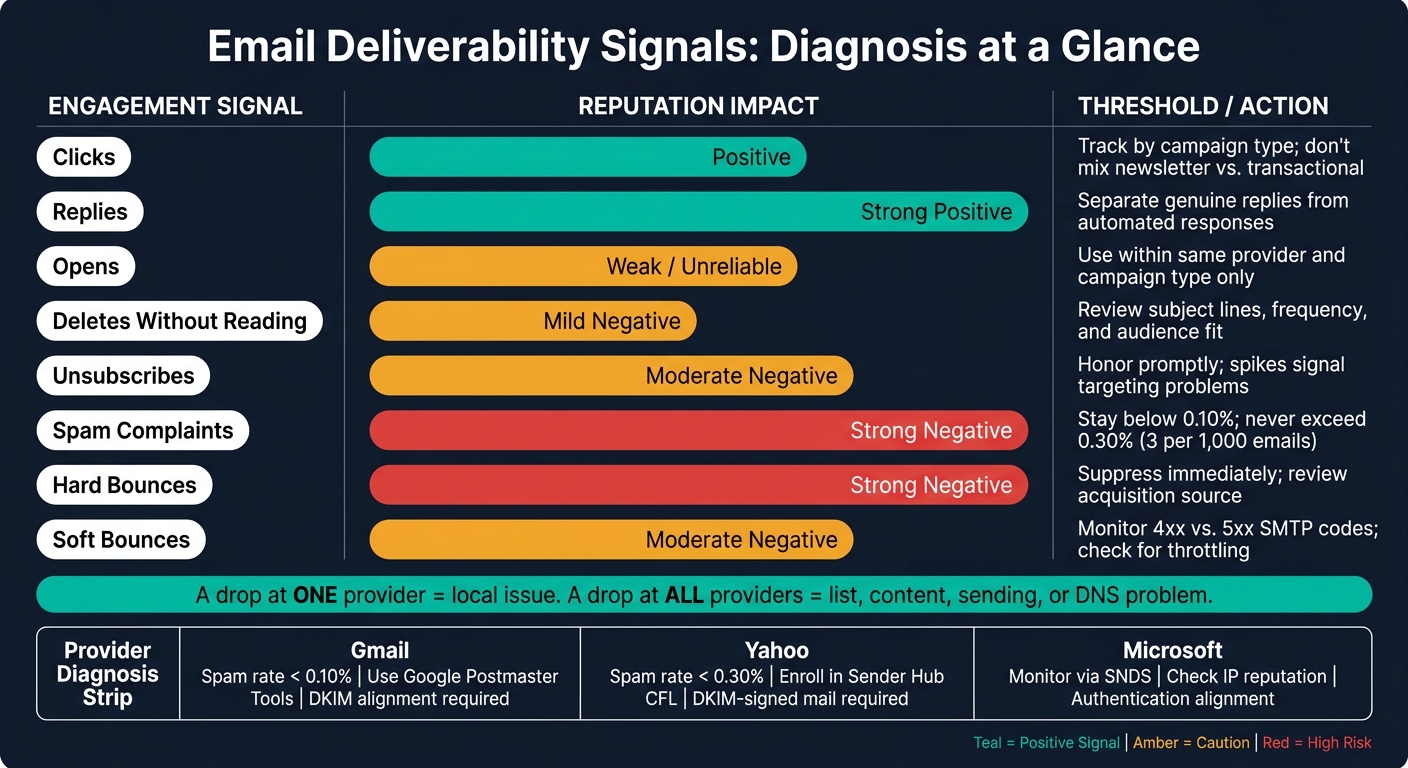
Email Deliverability Signals: What Each Metric Means for Inbox Placement
Use those signals to find the point where deliverability started to slip. The goal is simple: identify when inbox placement changed and where it changed.
Pull the last 4-8 weeks of data and compare it with a stable earlier period using the same campaign types and same audience definitions. Track send volume, inbox-placement rate, hard and soft bounces, complaints, unsubscribes, and any recent shifts in frequency, list size, content, authentication, or infrastructure.
Break Down the Problem by Provider, Campaign, and Audience
Slice the data by provider, campaign type, and audience. Look at both rates and raw counts. A 0.5% complaint rate from 200 sends does not mean the same thing as 0.5% from 200,000 sends.
Break it down by:
- Provider: Gmail, Yahoo, Microsoft, and other major domains
- Campaign type: newsletter, promotional, transactional, or re-engagement campaigns using tools like Systeme.io
- Audience: new subscribers, active contacts, inactive contacts, recently imported records, acquisition source
These cuts tell you what kind of problem you're dealing with.
A drop limited to Gmail points to one line of inquiry. A drop that hits Gmail, Yahoo, and Microsoft at the same time points to another. In the same way, weak clicks clustered in a newly imported segment usually suggest list quality or poor fit. Weak clicks across every audience usually point to content, rendering, or tracking.
Timing matters too. If the decline starts right after a list upload, look at consent and source quality. If it starts right after an infrastructure change, check authentication, DNS, or throttling.
Use those splits to decide what proof you need next: provider dashboards, bounce logs, or inbox tests.
Use Postmaster Tools, Sender Hub, Bounce Logs, and Inbox Tests
Each tool answers a different question. None gives you the whole story by itself.
Google Postmaster Tools shows Gmail spam rate, domain reputation, IP reputation, authentication, and delivery errors. Its spam-rate metric counts messages delivered to engaged Gmail recipients' inboxes and later marked as spam by those recipients. It does not include messages sent straight to the spam folder. Use it to see whether a reputation or authentication change lines up with the date your metrics started falling.
Yahoo Sender Hub and its Complaint Feedback Loop help you look into Yahoo-specific complaints. Outbound mail must be DKIM-signed and enrolled under the relevant domain. Use Sender Hub and complaint feedback data to isolate whether the drop is driven by complaints, authentication, or both.
For bounce logs, separate hard bounces from soft bounces. Hard bounces usually mean nonexistent addresses or invalid domains. Soft bounces usually mean throttling, temporary limits, or policy blocks. Keep the full SMTP response code in the log:
- 4.x.x = temporary and may be retried
- 5.x.x = permanent rejection
Patterns matter. A jump in hard bounces right after new contacts are added usually points to list quality. A jump in soft bounces right after an infrastructure change usually points to a technical problem.
Inbox-placement tests can help, but don't treat them like final proof. Seed mailboxes don't match real-user filtering, tabs, or engagement history. They're directional evidence, not proof.
Symptom-and-Cause Diagnosis Table
Use this table to match the pattern first. Then change the one factor most likely to be causing it.
| Symptom | Likely cause | Data needed to verify | Corrective action |
|---|---|---|---|
| Clicks fall despite stable inbox placement | Content mismatch, broken links, rendering issue, or tracking issue | Clicks by link and device; rendered-message test; redirect and analytics logs | Fix links or templates, reduce frequency, improve targeting, validate click tracking |
| Complaints rise right after a list upload | Weak consent, stale contacts, or poor suppression logic | Source, consent date, upload volume, complaint reports, welcome-message performance | Pause the source, confirm permission, suppress complainers, send only to verified opted-in contacts |
| Hard bounces increase after adding new contacts | Invalid addresses or inadequate validation at collection | Bounce codes by source and domain; signup form records; validation results | Remove invalid addresses, add real-time validation, review acquisition controls |
| Soft bounces spike after an infrastructure change | Throttling, DNS errors, authentication failure, or provider blocking | SMTP codes, sending IP, retry logs, SPF/DKIM/DMARC results, volume timeline | Correct technical issues, stabilize volume, contact ESP or provider if needed |
| Gmail reputation drops while Yahoo and Microsoft stay stable | Gmail-specific complaint, authentication, or engagement problem | Google Postmaster Tools, Gmail delivery errors, campaign metrics, authentication data | Reduce risky volume, target active recipients, address complaints, verify DKIM alignment |
| Engagement drops across every provider and audience | Broad relevance problem, tracking issue, sudden volume spike, or shared technical issue | Link-level clicks, analytics logs, template rendering, volume history, DNS/authentication checks | Test measurement integrity first, then review content, frequency, audience quality, and infrastructure |
How to Fix Weak Engagement Signals and Recover Inbox Placement
Once you know which provider, segment, or campaign is slipping, fix four things together: audience quality, relevance, cadence, and authentication. If you only change one, recovery usually stalls. Use the provider and segment patterns from the diagnosis stage to decide which contacts to clean up first.
Focus on Active Segments and Remove Inactive Contacts
Start by splitting contacts into four groups: active, declining, dormant, and unengaged after re-engagement. That gives mailbox providers a cleaner picture of how people respond to your mail, and it cuts the drag inactive contacts put on sender reputation.
Use:
- a 4-month active window
- a 4 to 6-month re-engagement window
- suppression for contacts inactive for 6 to 12 months unless they re-opt in
Set the inactivity window based on your send frequency and buying cycle, then stick with it. If the window keeps moving, your data gets messy fast.
For engagement, use actions that show actual interest: clicks, replies, purchases, site visits, preference updates, and conversions.
Run Re-Engagement Sequences, Align Content, and Make Unsubscribing Easy
Dormant contacts pull engagement down, so re-qualify them before you send again. Keep the re-engagement sequence short. Remind recipients why they are on the list, ask them to update preferences or confirm interest, then pause mail if they do nothing.
Stop the sequence on any click, reply, purchase, unsubscribe, complaint, or bounce. Limit re-engagement sends to 10% of daily sends to engaged users. If the sequence leads to high complaints, elevated bounces, or little meaningful activity, suppress the remaining contacts.
On the message side, the promise needs to match from start to finish. Your subject line, preview text, body copy, and landing page should all point to the same value. In re-engagement emails, use one primary call to action. Also give subscribers frequency or topic controls so they can stay on the list without feeling boxed in.
Make unsubscribing obvious and one-click. If people are no longer interested, you want them to opt out - not hit spam. Implement the List-Unsubscribe and List-Unsubscribe-Post headers following RFC 8058. Gmail requires bulk senders to honor unsubscribe requests within 48 hours.
Check Authentication Records and Track the Right Recovery Metrics
Authentication will not fix weak engagement by itself, but it does remove trust failures that can slow recovery. Verify SPF, DKIM, and DMARC for every sending domain, and confirm that the From domain aligns with the authenticated domain. Check DNS records, DKIM selector health, DMARC aggregate reports, and any third-party platform that might be breaking alignment.
Suppress hard bounces right away and dig into repeated soft bounces. Sync unsubscribes and complaints across every sending system so a removed address does not get added back by mistake.
Only track recovery after the list and message changes are in place. Before that, the numbers are noisy. Watch unique clicks per delivered email, reply rate, conversion rate, complaint rate, bounce rate, unsubscribe rate, and provider reputation signals from Google Postmaster Tools, Microsoft SNDS, and Yahoo Sender Hub. Review results by provider and segment across several sends.
| Recovery decision | Lower-risk approach | Higher-risk approach |
|---|---|---|
| Audience | Active and recently engaged subscribers first | Same campaign to the entire database |
| Engagement measurement | Clicks, replies, conversions, purchases | One open as proof of interest |
| Dormant contacts | Limited re-engagement sequence, then suppress | Continue sending indefinitely |
| Unsubscribe | Visible link and one-click header | Hidden link or account login required |
| Technical trust | Validate SPF, DKIM, DMARC, bounces, and alignment | Assume authentication alone fixes poor engagement |
Monthly Monitoring: What Teams Should Track and Review
Once you’ve fixed audience and content issues, check the same signals every month to make sure placement is moving back in the right direction. Engagement is a deliverability signal, not a vanity metric, so it needs a steady review cycle if you want it to mean anything.
After recovery changes go live, review trends each month at the provider, segment, and campaign level - grouped by sending domain and IP, audience segment, and campaign type. Blended averages can hide provider-level trouble, so look at the full chain at each level: engagement drops, reputation gets weaker, placement slips, then monitoring shows whether recovery is holding.
Set Alerts and Keep a Change Log
Set alerts for sharp moves away from your baseline. This should feel like an extension of diagnosis, not a new reporting layer. Watch the same signals each month instead of piling on new metrics. Complaint and spam-rate thresholds should act as risk boundaries. The direction of the trend matters more than one bad day.
Keep a change log and tie each alert to the exact send, audience, and infrastructure change behind it. Each entry should include:
- Date
- Campaign
- Audience source
- Sending domain and IP
- Any authentication or frequency change made that week
Without that record, the team is guessing.
Key Takeaways for Deliverability Recovery
Track engagement by provider and segment. Fix drift early. Expand volume only after several stable sends.
Recovery only counts as real after several stable sends across the affected providers and segments, with complaint rates below your alert threshold and clicks improving from active segments.
FAQs
Why is deliverability dropping if delivery stays high?
Deliverability can slip even when delivery rates look high. Why? Because mailbox providers look at engagement, not just whether an email was accepted by the server.
If people ignore your emails, stop opening them, or mark them as spam, your sender reputation can weaken. And once that happens, more of your messages can end up in the spam folder instead of the inbox.
To improve deliverability, focus on list hygiene and make sure your domain is set up with SPF, DKIM, and DMARC authentication.
Which engagement metrics matter most to mailbox providers?
Mailbox providers look at engagement signals to decide if your emails are wanted or if they look like spam.
The two main signals are open rates and click-through rates (CTR). These show whether people notice your emails and whether the content feels relevant enough to act on.
Providers also track bounce rates and unsubscribe rates. Those metrics help them judge list hygiene and sender reputation. If you keep bounce rates below 2%, your emails are more likely to land in the inbox instead of the spam folder.
How long does it take to recover inbox placement?
There’s no fixed timeline for getting inbox placement back on track. It comes down to rebuilding trust with internet service providers through steady, positive sending patterns over time.
In most cases, recovery means tightening up SPF, DKIM, and DMARC, cleaning your list, removing inactive or invalid addresses, and slowly warming up your domain or IP. Automated tools can help, too. They can track placement, flag spam triggers, and support engagement as you work back to a healthier sending reputation.