In 2026, effective CRM benchmarking is critical for improving sales and marketing performance. With the CRM market projected to reach $126.17 billion, many businesses still struggle - 55% of CRM implementations fail to meet goals. Benchmarking helps identify gaps in your sales funnel, optimize conversion rates, and improve pipeline efficiency.
Key takeaways:
- Benchmarking CRM metrics ensures your system aligns with industry standards and internal goals.
- Focus on conversion rates (e.g., MQL to SQL, SQL to Opportunity) and pipeline metrics like Win Rates and Pipeline Velocity.
- Data quality matters: 76% of users report less than 50% data accuracy. Regular audits and cleanup are essential.
- Trends in 2026: AI-driven CRM tools, multi-touch attribution, and metrics like AXO Score are reshaping strategies.
- Actionable steps include defining metrics, cleaning data, running benchmarks, and addressing funnel gaps.
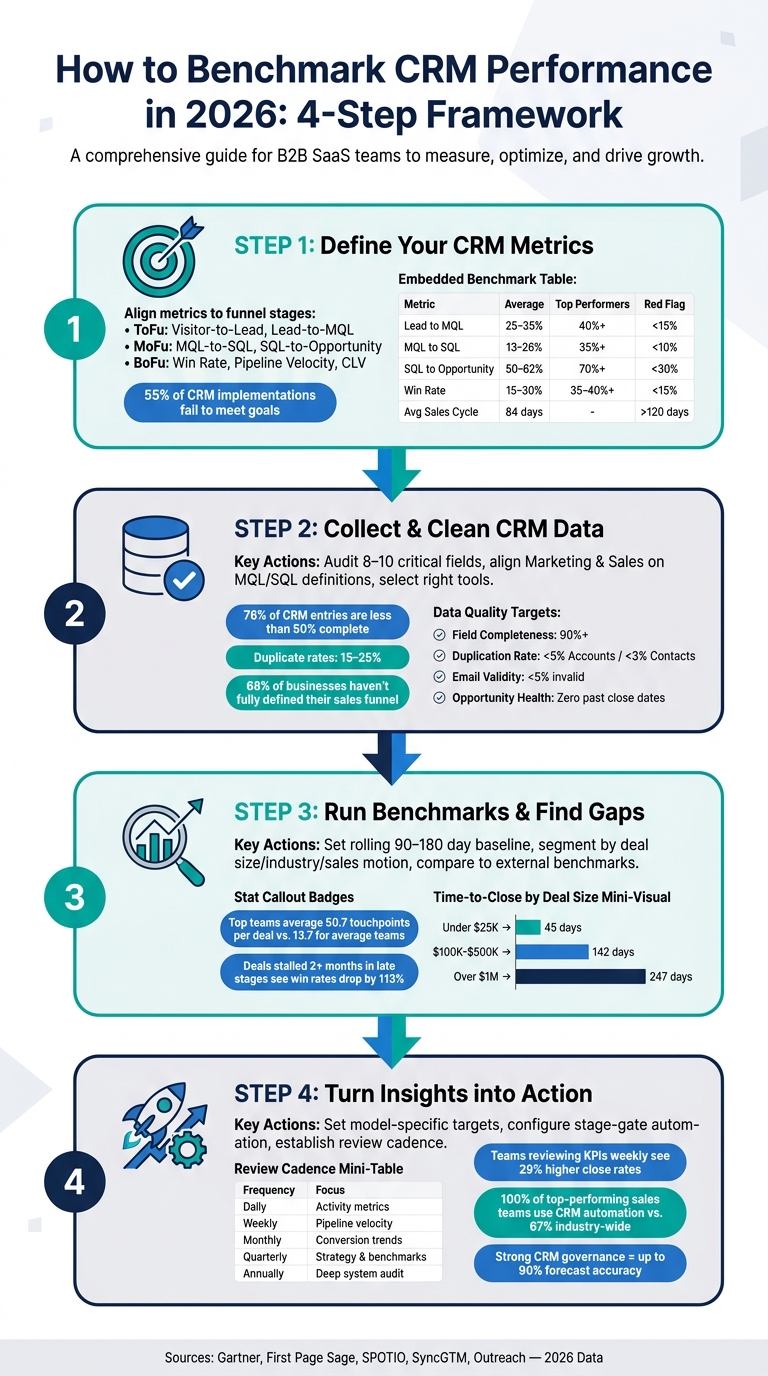
How to Benchmark CRM Performance in 2026: 4-Step Framework
Step 1: Define the CRM Metrics You Will Benchmark
Before diving into data collection, start by clearly outlining the CRM metrics you’ll use to identify gaps in your sales funnel. Focus on metrics that tie directly to business outcomes rather than those that are simply easy to gather. A well-defined metric framework ensures that your efforts yield actionable insights.
Aligning Metrics with Funnel and Pipeline Stages
Every metric you track should correspond to a specific stage of your funnel. Without this alignment, you risk collecting data that doesn’t lead to meaningful decisions.
Break your funnel into three main layers:
- Top-of-funnel (ToFu): Focus on metrics like Visitor-to-Lead rate and Lead-to-MQL conversion to assess lead volume and quality.
- Mid-funnel (MoFu): Track MQL-to-SQL rate, SQL-to-Opportunity rate, and Account Engagement Score to identify where deals gain traction or stall.
- Bottom-of-funnel (BoFu): Concentrate on Win Rate, Sales Cycle Length, and Pipeline Velocity to monitor revenue outcomes. After the sale, shift attention to metrics like Churn Rate, Customer Lifetime Value (CLV), and the LTV:CAC ratio.
Mapping metrics to these stages is critical. As Kushal Magar from SyncGTM explains:
"Most B2B funnel problems are not lead volume problems. They are conversion problems hiding at one or two specific stage transitions."
Core CRM Metrics to Benchmark
Once you’ve mapped your funnel stages, focus on metrics that provide the most diagnostic value. Here are key benchmarks for 2026:
| Metric | 2026 Average | Top Performers | Red Flag |
|---|---|---|---|
| Lead to MQL | 25–35% | 40%+ | <15% |
| MQL to SQL | 13–26% | 35%+ | <10% |
| SQL to Opportunity | 50–62% | 70%+ | <30% |
| Win Rate (Opp to Close) | 15–30% | 35–40%+ | <15% |
| Average Sales Cycle Length | 84 days | - | >120 days |
Source: Aggregated from Gartner, First Page Sage, and SPOTIO 2026 data.
Two additional metrics deserve attention:
-
Pipeline Velocity: A critical indicator of potential revenue. Calculate it with this formula:
(Number of Qualified Opportunities × Average Deal Value × Win Rate) ÷ Average Sales Cycle Length in Days.
A drop in pipeline velocity often signals revenue issues before they appear in closed deals. - Pipeline Coverage Ratio: This measures how much pipeline you have relative to your revenue goals. A healthy range is typically 3x to 5x your quota, but it varies by segment. For example, SMB teams often need 2.5x–3x, mid-market teams around 3x, and enterprise teams 4x–5x due to longer sales cycles and higher deal risks.
How to Choose Benchmarks and Set Thresholds
Using industry averages without segmenting your data can lead to misleading conclusions. Maria Akhter, Editor at Outreach, highlights this:
"Industry averages are poor diagnostics... the range within a single vertical is wide enough that the average alone tells you nothing about your own performance."
To get accurate benchmarks, segment your data by factors like channel, deal size, and lead source. For instance, inbound organic leads generally convert at higher rates than outbound or paid leads.
When setting thresholds, use a rolling 90- to 180-day window instead of focusing on single-quarter snapshots. This approach smooths out seasonal variations and provides a more reliable baseline. Then, incorporate industry reports - like SyncGTM’s 2026 benchmarks or Gartner data - to fine-tune your targets based on your specific vertical and sales strategy.
Remember, a metric is only valuable if it points to a clear issue that you can address. As Kushal Magar puts it:
"Contacts added to CRM" is a metric. "SQL-to-opportunity conversion rate" is a KPI - because a drop signals a specific problem."
sbb-itb-a84ebc4
Step 2: Collect and Analyze Your CRM Data
Once you've defined your metrics, it's time to make sure your CRM data is reliable. Why? Because incomplete or duplicate records can completely skew your benchmarks. For instance, 76% of CRM entries are less than half complete, and duplicate rates hover between 15–25%. Without accurate data, your insights - and ultimately, your funnel performance - will be off track.
Preparing Your CRM Data for Benchmarking
Jumping into cleanup without understanding your data's scope can waste time and resources. A structured audit is the smarter first step. It not only gives you a clear baseline but also helps pinpoint the root causes of data issues before you start fixing them.
Focus on the 8–10 key fields that impact scoring, routing, and reporting. These might include fields like company domain, industry, employee count, and job title. Audit each object type - Accounts, Contacts, and Opportunities - for completeness, accuracy, and realistic close dates. For example, any open deal with a close date in the past is a glaring issue that can distort your pipeline metrics.
Another critical step is ensuring alignment between Marketing and Sales on stage definitions. Did you know that 68% of businesses haven't fully defined or documented their sales funnel strategy? If Marketing and Sales don't agree on what qualifies as an MQL versus an SQL, your conversion metrics will lack consistency, making your benchmarks unreliable.
Once you've audited your data, it's time to select tools that streamline collection and analysis.
Tools to Use for CRM Data Collection and Analysis
The tools you choose should match the complexity of your data needs. For teams focused on internal reporting, native CRM tools like Salesforce CRM Analytics or HubSpot's Custom Report Builder are excellent options. These tools integrate seamlessly into your existing workflows and provide insights into conversion trends without requiring external connectors.
However, if your data needs go beyond CRM - like combining it with marketing spend, web behavior, or product usage - an ETL or integration layer is essential. Platforms like Fivetran (costing $1,500–$5,000/month) or Improvado can sync CRM data into warehouses like BigQuery or Snowflake, enabling more complex attribution models. If you need to push processed data back into your CRM, Reverse ETL tools like Hightouch or Census can handle that.
For executive dashboards that combine CRM data with financial or product metrics, tools like Power BI, Tableau, or Looker are the go-to choices.
| Tool Category | Best For | Examples |
|---|---|---|
| Native CRM | Simple, internal reporting | Salesforce Reports, HubSpot Custom Builder |
| ETL/Reverse ETL | Bulk data movement and attribution | Fivetran, Improvado, Hightouch |
| iPaaS | Event-based triggers and field mapping | Zapier, Workato |
| BI Tools | Cross-functional executive dashboards | Power BI, Tableau, Looker |
With the right tools, you can focus on maintaining data quality.
Maintaining Data Quality and Accuracy
Keeping your CRM data clean is not a one-and-done task - it’s an ongoing effort. Here are some benchmarks to aim for:
| Data Dimension | Target Benchmark | Impact of Failure |
|---|---|---|
| Field Completeness | 90%+ for mandatory fields | Poor segmentation and territory planning |
| Duplication Rate | Below 5% (Accounts) / 3% (Contacts) | Confused sales reps and split activity history |
| Email Validity | Below 5% invalid rate | High bounce rates and damaged sender reputation |
| Opportunity Health | Zero deals with past close dates | Misleading pipeline metrics and inaccurate forecasts |
Two practices can make a big difference in sustaining these benchmarks. First, enforce required fields at key stage transitions using stage-gate workflows. This prevents bad data from entering the system in the first place. Second, go beyond exact matches when checking for duplicates. Look for variations like "IBM" versus "International Business Machines" and use tools like Cloudingo or DemandTools to run weekly deduplication checks.
"The most consistent cause of inaccurate forecasts is poor CRM data hygiene." - Mria Labs Team
Improving data quality isn't just about avoiding mistakes - it has tangible benefits. For example, better CRM hygiene can improve forecast accuracy by up to 30%. To stay ahead of data decay (which can range from 22.5% to 70.3% annually for B2B contact data), schedule monthly spot checks on critical fields and conduct a full audit every quarter.
Step 3: Run Benchmark Tests and Find Performance Gaps
Now that your data is cleaned and organized, it’s time to run your benchmarks. This step shifts the focus from preparation to diagnosing performance by measuring key metrics, comparing them to industry standards, and identifying where improvements are needed.
Setting a Performance Baseline
A performance baseline is your reference point for all comparisons. Start by calculating key metrics - like conversion rates, win rates, sales cycle length, and pipeline coverage - over a multi-month rolling window. This approach smooths out seasonal fluctuations and provides a more accurate picture than a single-quarter snapshot.
It’s critical to segment baselines by different sales motions instead of applying a one-size-fits-all approach across your sales teams. For instance, pipeline coverage expectations for a Product-Led Growth (PLG) model hover around 2.4x, while an Enterprise model typically requires 4.4x. Combining these into a single baseline creates a number that doesn’t accurately reflect either model.
Comparing Your Metrics to External Benchmarks
Once you’ve established your baseline, compare it to external benchmarks. Break down your metrics by deal size, industry, and sales motion before pulling in any outside data.
For example, time-to-close varies significantly by deal size: deals under $25,000 typically close in 45 days, while deals between $100,000 and $500,000 take about 142 days, and deals over $1M stretch to 247 days. The table below offers industry-specific pipeline conversion benchmarks for 2026:
| Industry | MQL to SQL (%) | Opportunity to Close (%) |
|---|---|---|
| B2B SaaS (Enterprise) | 35–40% | 30–35% |
| B2B SaaS (SMB) | 32–39% | 39–46% |
| Financial Services | 35–46% | 35–50% |
| Manufacturing | 35–45% | 45–55% |
| Healthcare/Medtech | 30–45% | 40–55% |
"Industry averages are poor diagnostics: Opportunity-to-close rates cluster between 25 and 50 percent for most B2B segments, but the range within a single vertical is wide enough that the average alone tells you nothing about your own performance." - Maria Akhter, Editor, Outreach
These comparisons will highlight specific performance gaps that need attention.
Diagnosing Funnel and Pipeline Gaps
Once you’ve identified gaps, link them back to your funnel strategy for targeted solutions. For instance, if your MQL-to-SQL conversion rate falls below 32–35%, it could point to problems with lead definitions or follow-up processes.
Another critical area to evaluate is engagement frequency. High-performing teams average 50.7 touchpoints per deal - 3.70 times more than average teams, which only manage 13.7. If your team’s follow-up numbers are low, this could explain underwhelming win rates.
Also, keep an eye on late-stage deal slip. Deals that stall for more than two months in advanced stages see win rates drop by 113%. Setting up automated alerts for deals with no activity after 45 days is a simple yet effective way to prevent this.
"Adding pipeline to a broken conversion stage generates costs, not revenue." - Outreach
Step 4: Turn Benchmark Insights into Action
This step is all about taking the insights you've gained from benchmarking and turning them into meaningful actions that improve your CRM performance. By focusing on better targets, smarter CRM setups, and a regular review process, you can keep driving improvements forward.
Setting Targets and Tracking Progress
Effective targets are specific to your business model - not just generic industry averages. For instance, a legal firm using a "Relationship Builder" model might require 50–70 touchpoints per deal, while a construction company operating as a "Volume Player" may only need 8. Applying the same benchmarks across different models leads to confusion and inefficiency.
After setting your targets, establish clear intervention triggers to enable timely action. For example:
- Flag deals that remain in the same stage for more than 21 days.
- Alert a manager if a sales rep hasn’t logged in for five consecutive days.
These triggers turn dashboards into proactive tools, helping your team act before small issues turn into big problems.
"You cannot improve what you do not measure. But you can drown in what you measure too much." - Vonsel CRM Guide
Align your review frequency with the type of metric. For instance:
- Daily: Activity metrics like calls or emails logged.
- Weekly: Metrics like pipeline velocity.
- Monthly or Quarterly: Strategic ratios such as CAC (Customer Acquisition Cost) to CLV (Customer Lifetime Value).
Teams that review KPIs weekly enjoy a 29% higher close rate compared to those that don’t. These reviews lay the groundwork for refining your CRM processes, building a profitable online business through better alignment, and automating critical tasks.
Improving CRM Configuration and Processes
With targets in place, adjust your CRM configuration to support those goals. Benchmark gaps often highlight areas where CRM workflows need redesigning. One effective approach is value-based pipeline routing. For example:
- Use an "Express Lane" with just two stages for low-value, high-volume deals.
- Set up a more detailed pipeline (5+ stages) for complex, high-value opportunities.
This prevents smaller deals from getting bogged down in processes meant for large contracts.
Another impactful change is stage-gate automation. For instance, when a deal moves to the proposal stage, the CRM can automatically generate a task to send pricing documentation. This eliminates guesswork and ensures no step is missed. Notably, 100% of top-performing sales teams use CRM automation, compared to just 67% industry-wide.
"A CRM platform on its own does not create alignment, forecasting accuracy, or pipeline discipline. A well-designed CRM strategy does." - Prateek Mathur, Activated Scale
Making Benchmarking a Regular Practice
To maintain ongoing improvements, establish a regular benchmarking schedule. Here’s a practical review cadence:
| Frequency | Focus Area | Key Activities |
|---|---|---|
| Weekly | Pipeline & Activity | Review coverage ratios, cold deals, and activity logging rates |
| Monthly | Conversion Trends | Analyze stage-to-stage conversion health and leadership dashboards |
| Quarterly | Strategy & Benchmarks | Compare metrics to industry benchmarks and review win rates by source |
| Annually | Deep System Audit | Conduct a comprehensive review of data, pipeline structure, automation, and integrations |
Source: Compiled from Mria CRM Reporting Guide and CRM Masters Audit.
Quarterly reviews are ideal for comparing your metrics to external benchmarks and adjusting thresholds. Annual audits go deeper, identifying issues like duplicate records, broken workflows, or outdated custom fields that may quietly slow down your system.
"CRM rollouts fail at the strategy and process layer, not at the software layer." - Matt Kiełbasa
Finally, make the CRM the sole source of truth for commissions. If reps can adjust numbers in spreadsheets, they will. Tying compensation directly to CRM data ensures consistent usage and reinforces the system's reliability.
Conclusion: Building a Cycle of CRM Performance Improvement
Improving CRM performance isn’t a one-and-done task - it’s a continuous process. The steps outlined here - defining key metrics, collecting accurate data, identifying gaps, taking action with insight selling, and repeating - create an iterative cycle. Each round fine-tunes your CRM, keeping it aligned with your business’s changing needs.
The foundation of this process is clean, reliable data. To ensure your CRM delivers meaningful insights, establish governance practices like mandatory fields, clear ownership rules, and data validation. Without these measures, you risk measuring noise instead of actual performance. Companies that prioritize data governance can achieve forecast accuracy rates as high as 90%.
"Organizations with strong CRM governance demonstrate up to 90% forecast accuracy. Reliable CRM data is not hygiene. It is revenue infrastructure." - Everready.ai
When choosing metrics, focus on 5–7 KPIs that directly influence revenue decisions, such as win rates, deal velocity, cycle length, stage conversion rates, and rep productivity. A practical tip: if it takes more than 30 seconds for a sales rep to find their performance data in the CRM, chances are they won’t bother checking it.
This focused approach works best when paired with strong leadership oversight. Make CRM benchmarking a regular part of leadership reviews, integrating it into weekly or quarterly meetings. This keeps teams accountable and ensures your CRM strategy evolves based on real performance data - not guesswork.
"A CRM strategy should evolve with performance data, not assumptions." - Prateek Mathur, Activated Scale
FAQs
Which 5–7 CRM KPIs should we benchmark first?
When evaluating the effectiveness of your CRM system, these metrics are essential to track:
- Win Rate: This measures the percentage of qualified opportunities that result in a closed deal. A higher win rate often reflects strong sales performance and effective CRM usage.
- Pipeline Velocity: This tracks how quickly revenue progresses through your sales funnel. Faster velocity indicates an efficient pipeline and smoother sales processes.
- Lead-to-Customer Conversion Rate: This shows the proportion of leads that successfully convert into paying customers, offering insight into the quality of your lead nurturing and sales efforts.
- Average Deal Cycle Length: This metric captures the time it takes to close a deal, from initial contact to final agreement. Shorter cycles typically mean a more streamlined sales process.
- Customer Retention Rate: This percentage highlights how well you’re maintaining relationships with existing customers, a critical factor for long-term growth and profitability.
- Data Quality Score: This evaluates the accuracy and completeness of the data in your CRM, which is crucial for informed decision-making and effective customer management.
Tracking these KPIs can help you identify strengths and areas for improvement in your CRM strategy.
How can I set benchmarks by segment instead of averages?
To establish benchmarks by segment, begin by evaluating baseline data tailored to specific audience types, campaign objectives, or intent. Dive into current metrics such as win rates, conversion rates at different stages, and average deal sizes for each segment.
Organize CRM data by key attributes like team, product line, or lead source. Then, compare these segments using consistent KPIs, such as engagement levels or revenue figures. For deeper insights, consider both internal performance trends and broader industry standards.
What’s the fastest way to fix bad CRM data before benchmarking?
To clean up bad CRM data quickly, a targeted audit with automated tools is your best bet. Start by exporting your data and running a completeness scan. This will help you pinpoint missing values in essential fields, such as job titles or industries.
Next, use fuzzy matching to merge duplicate records. Pay special attention to duplicates linked to active deals or ongoing campaigns. This approach helps you tackle the most critical gaps first, reducing potential revenue loss and keeping your CRM data in better shape.